Bitcoin Price Analysis Dec.6: Will the critical daily support-line hold?
As mentioned before and in our previous price analysis, the bearish momentum is far from being over.
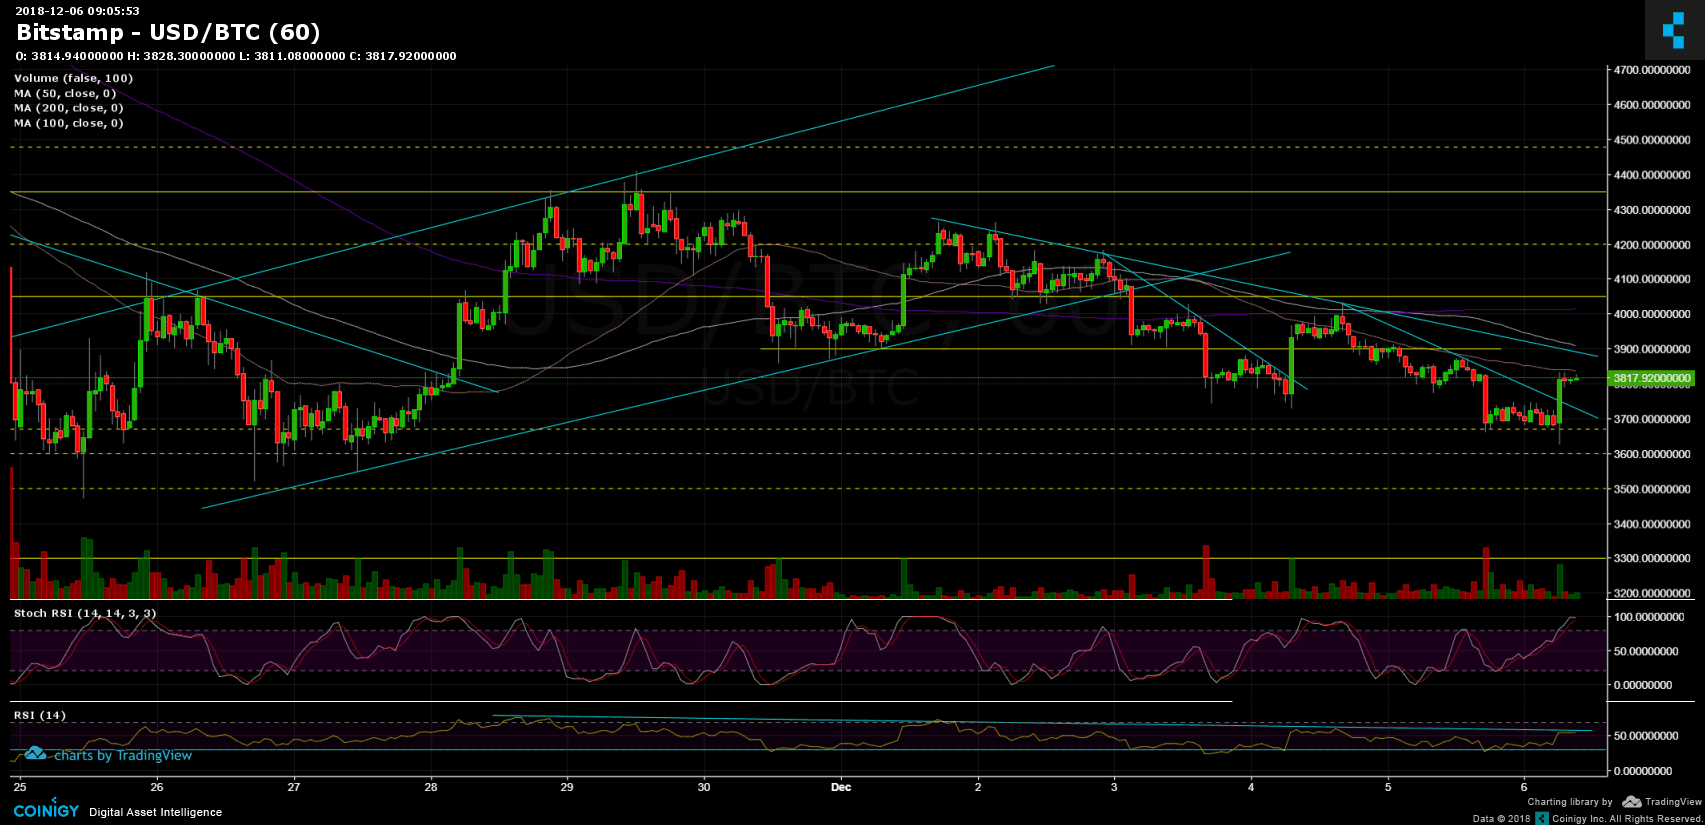
Despite the bounce from $3700 to $3900, since it’s Nov.29 high ($4400) Bitcoin is creating lower lows (as seen on the hourly chart).
The current weekly bottom lies at $3630 (Bitstamp). Reaching there was followed by a nice bounce back above the $3800 level, touching the 50 days moving average line (the pink line on the 1-hour chart).
Looking at the 1-day & 1-hour charts
- The short-term: The hourly chart’s Stochastic RSI is about to cross at the overbought area. This might indicate on a possible correction down.
- From the bear side, the next support levels lie at $3800 and $3670, $3600, before getting to the yearly low’s area at $3500.
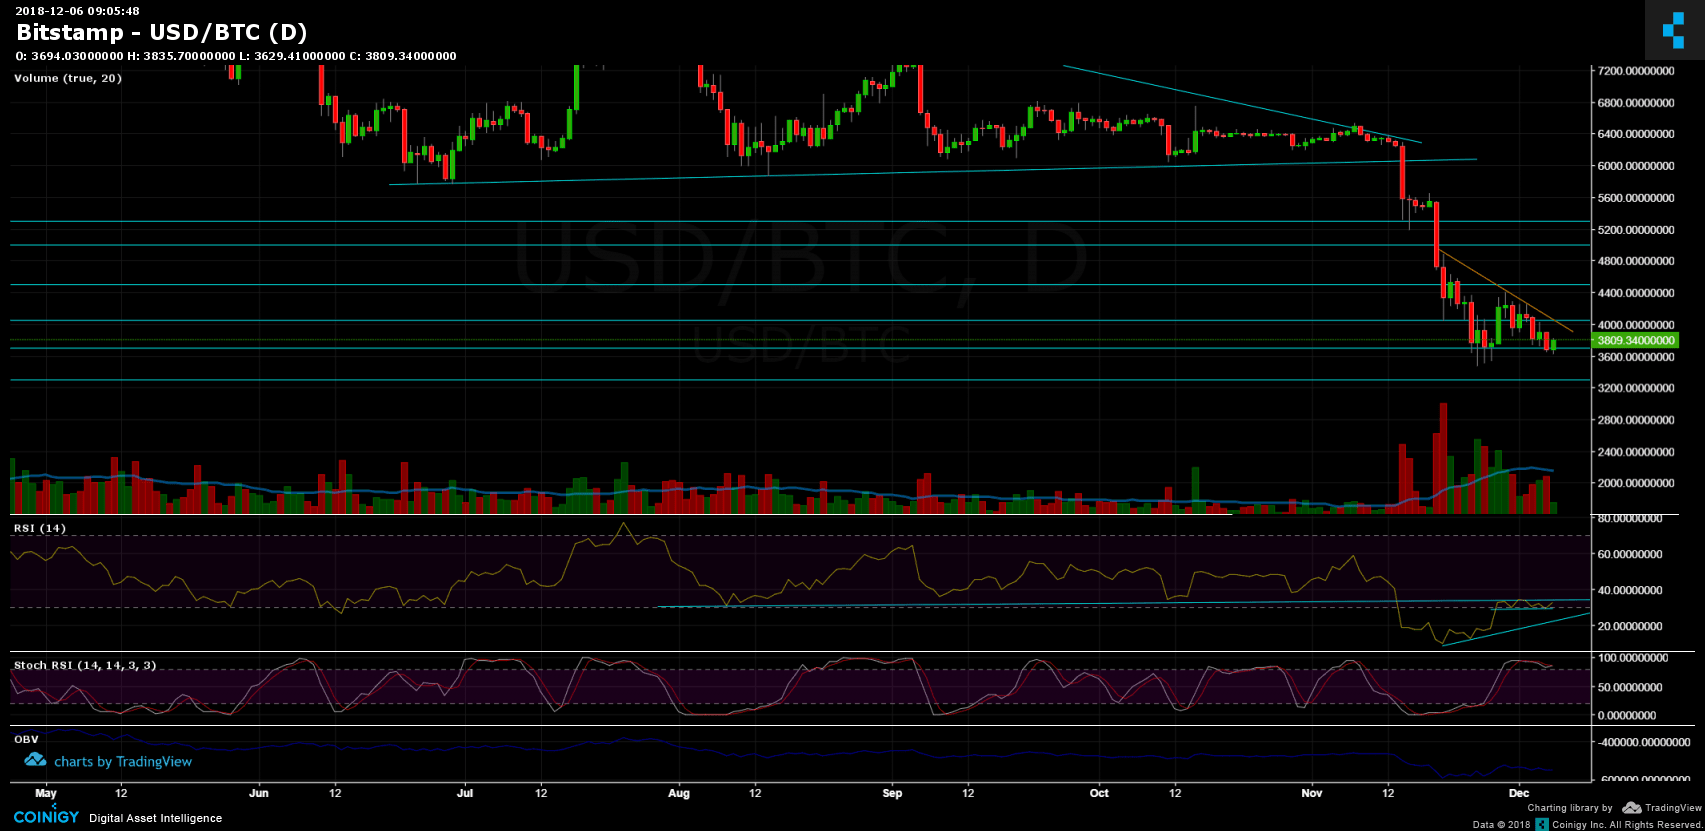
- The mid-term: As can be observed on the daily BTC chart, the $3700 support line still holds, while the overall movement is bearish according to the orange marked descending trend-line.
- From the bull side: the next resistance lies at the 50 days moving average (~$3850), descending trend-line at $3900. $4000 -$4050 resistance along with 200 days moving average (purple line).
- The trading volume is getting higher from day to day, but still not as much as the past week’s.
- The daily chart’s RSI indicator: The critical indicator is testing the support turned resistance RSI line for the fourth time during the past ten Breaking the above line could signal a short to mid-term bullish movement while failing from the 28.5 level is likely to send Bitcoin to look for new annual lows.
- BitFinex’s open short positions have increased to their weekly high at 37.6K.
BTC/USD BitStamp 1-Hour chart
BTC/USD BitStamp 1-Day chart
Cryptocurrency charts by TradingView. Technical analysis tools by Coinigy.
The post Bitcoin Price Analysis Dec.6: Will the critical daily support-line hold? appeared first on CryptoPotato.