Bitcoin Price Analysis Dec.3: Ascending Channel Broke-Down. Will $4K Hold?
On our yesterday’s price analysis we mentioned the fact that Bitcoin is trading around a weak and fragile zone: The bottom trend-line of the ascending channel, along with the critical $4000 – $4050 support area.
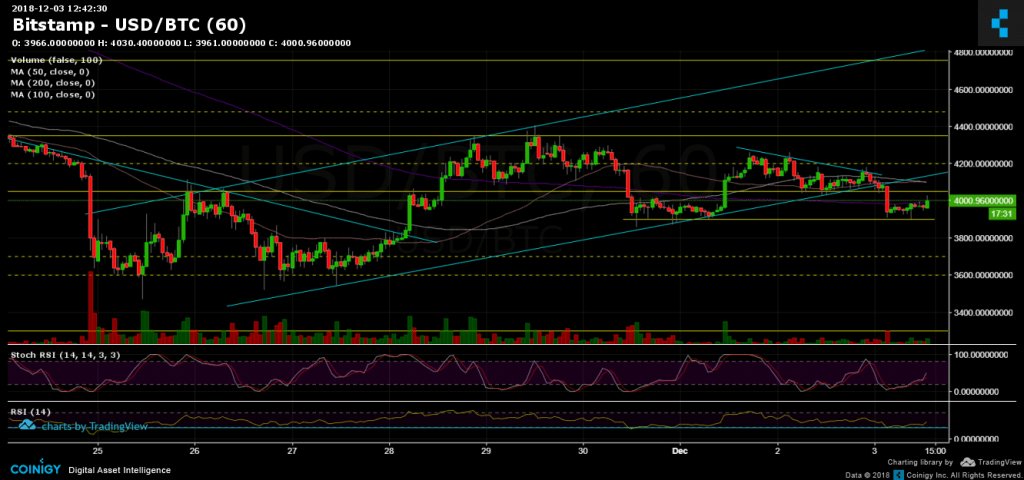
As of now, Bitcoin had broken the ascending channel support and found support at $3900. Since then, the movement is consolidating beneath the support-turned resistance 200 days moving average line (marked in blue on the following chart).
Looking at the 1-day & 1-hour charts
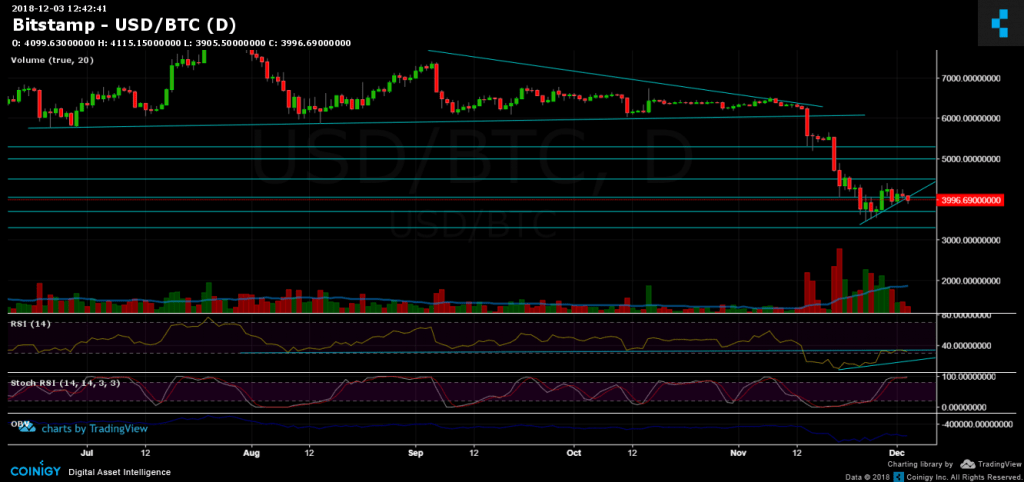
- The mid-term: Looking at the 1-day candle, there are still a couple of hours, but unless Bitcoin closes the day above $4100, the ascending trend-line of the daily chart will break.
- Still, on the daily chart, the RSI indicator is still testing the mid-term trend-line as resistance, while the Stochastic RSI oscillator is very close to cross at the overbought area.
- The trading volume decrease from day to day, but, still high volumes compared to the days before the breakdown of the $6000 area.
- The hourly chart’s Stochastic RSI had crossed at the oversold area. This might indicate on a possible correction up, maybe to test the resistance at $4050 for one last time.
- From the bear side, the next support levels lie at $3900, $3800 and $3700, before getting to the yearly low’s area at $3500.
- From the bull side, the next major resistance level lies around $4050, afterward is the $4250, and then the $4350 level. A bullish scenario might send Bitcoin to re-test the higher trend-line of the channel at the $4700 – $4800 area.
- BitFinex’s open short positions have sharply increased to 36.3K. We discussed the option of a short squeeze here.
BTC/USD BitStamp 1-Hour chart
BTC/USD BitStamp 1-Day chart
Cryptocurrency charts by TradingView. Technical analysis tools by Coinigy.
The post Bitcoin Price Analysis Dec.3: Ascending Channel Broke-Down. Will $4K Hold? appeared first on CryptoPotato.