Bitcoin Price Analysis Dec.25: BTC Drops As The Bears Are Still Here
Following yesterday’s analysis, Bitcoin tried hard to break the $4200 but failed. When you don’t break up, you lose momentum and drop, and this is precisely what has happened.
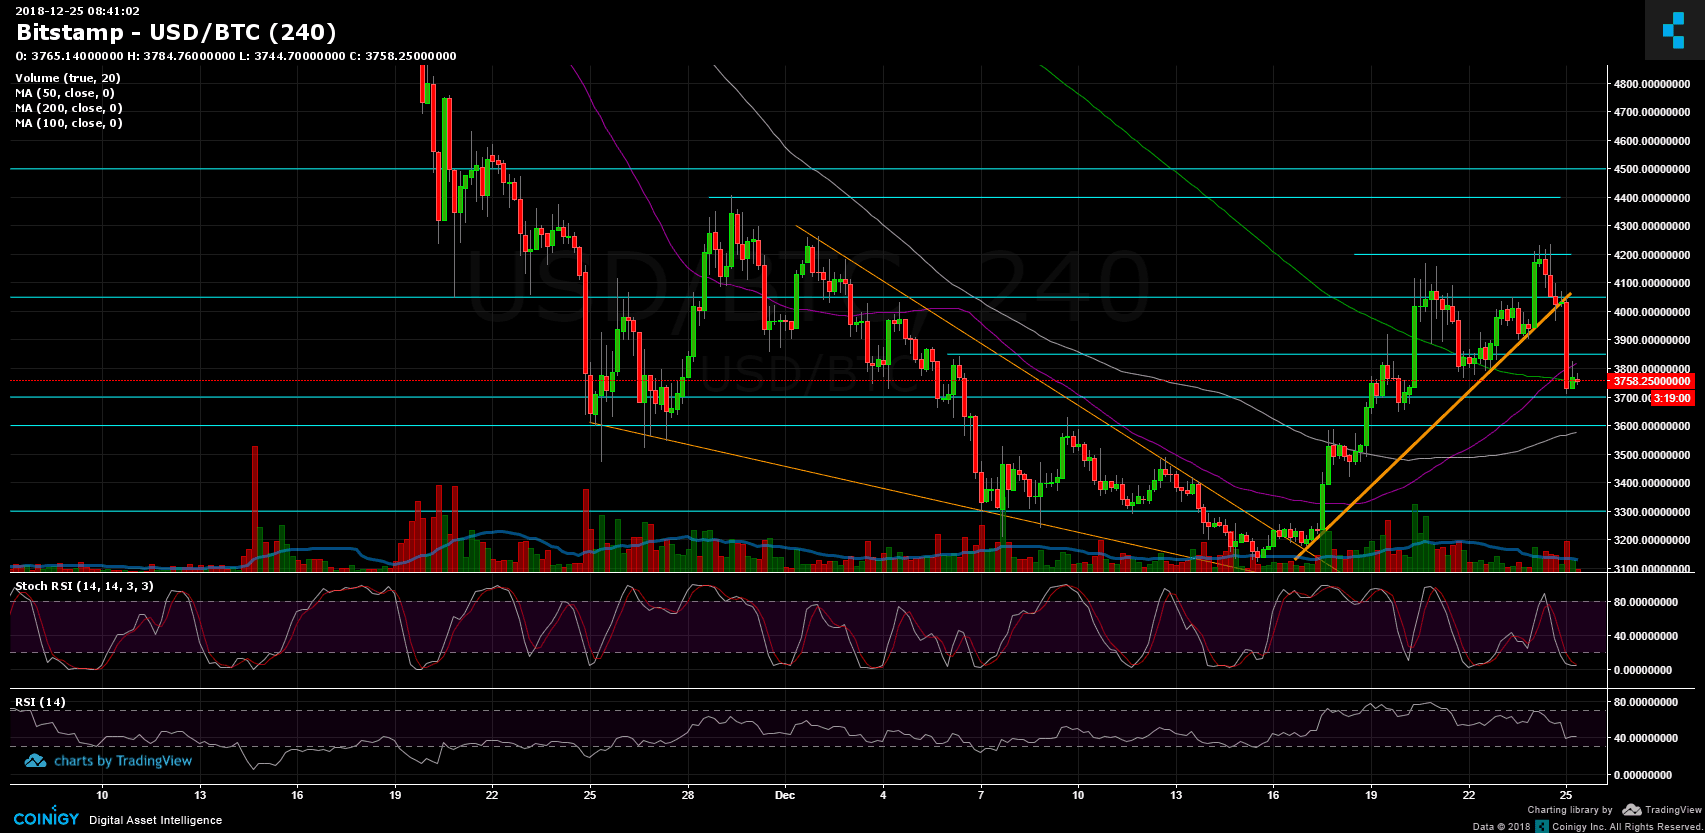
We also mentioned yesterday the Stochastic RSI, that had crossed over in the overbought area. Failing to break up the $4200 resistance, along with overbought RSI levels, led the market to a sharp correction down: At first, it looked like the mid-term ascending trend line holds (marked in orange on the 4-hour chart) but then it suddenly came, and a red $350 candle took the market to new daily lows.
As of now, Bitcoin found temp support around the $3700 support level, along with the 200 days moving average line (marked in light green on the following chart).
Looking at the 1-day & 4-hour charts
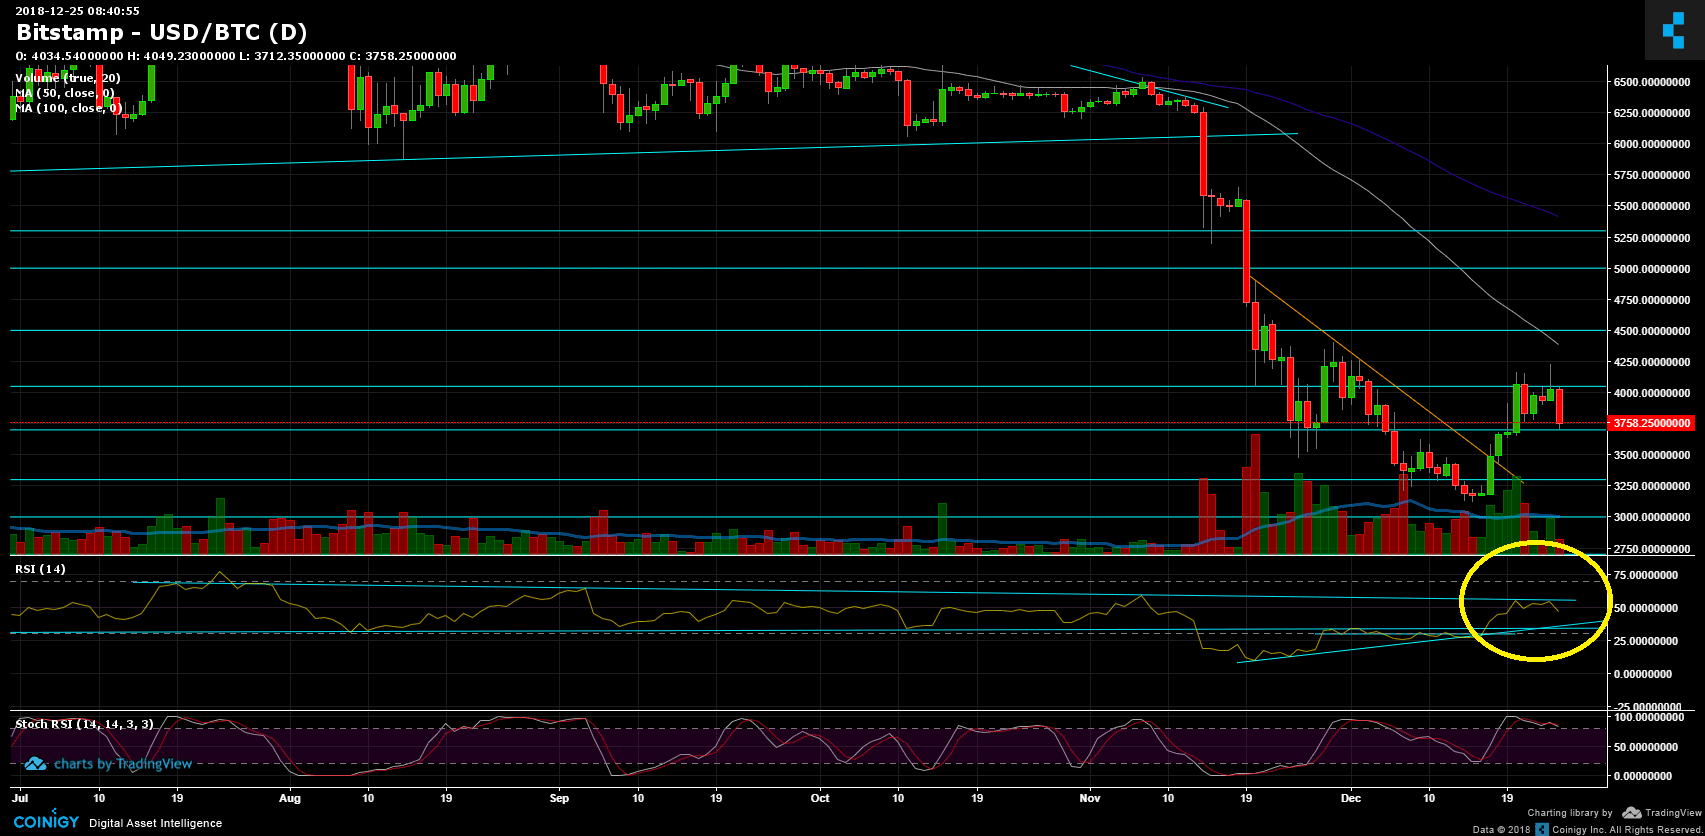
- The bear market is not over yet. As mentioned before, only breaking up of the $4500 prior-high (along with the MA-50, 1-day chart) and re-testing the level as support could change the longer term momentum. Until then, the market is considered bearish and might also retest annual lows.
- In case of breaking down the $3700 support, the next significant support lies at $3600 along with MA-100 (4-hour chart). Below there is the $3480 support level.
- We also mentioned yesterday about the daily chart’s RSI, which was creating lower highs and was about to break out the descending line. Unfortunately, this didn’t happen, and the RSI had failed to break the resistance (marked in the yellow circle on the daily chart). However, the RSI of the daily chart is still strong above 80. Considering the fact that the whole situation is very fragile.
- For the next hours, we could expect a correction up, by looking on the 4-hour Stochastic RSI oscillator which is about to cross over at the oversold zone.
- Possible levels for correction could be prior support lines at $3850, $3900 and $4050.
- The trading volume is relatively low. This could be explained due to the holidays. However, it’s easier to maneuver the markets under these low-volume conditions.
- BitFinex’s open short positions had decreased to 32K BTC. As said – when shorts are at their ATH expect a short squeeze. When shorts are at the bottom, expect a long squeeze. This is exactly what has happened yesterday.
BTC/USD BitStamp 4-Hour chart
BTC/USD BitStamp 1-Day chart
The post Bitcoin Price Analysis Dec.25: BTC Drops As The Bears Are Still Here appeared first on CryptoPotato.