Bitcoin Price Analysis Dec.24: Green On The Screen – The Bullish Bitcoin Is Facing $4200
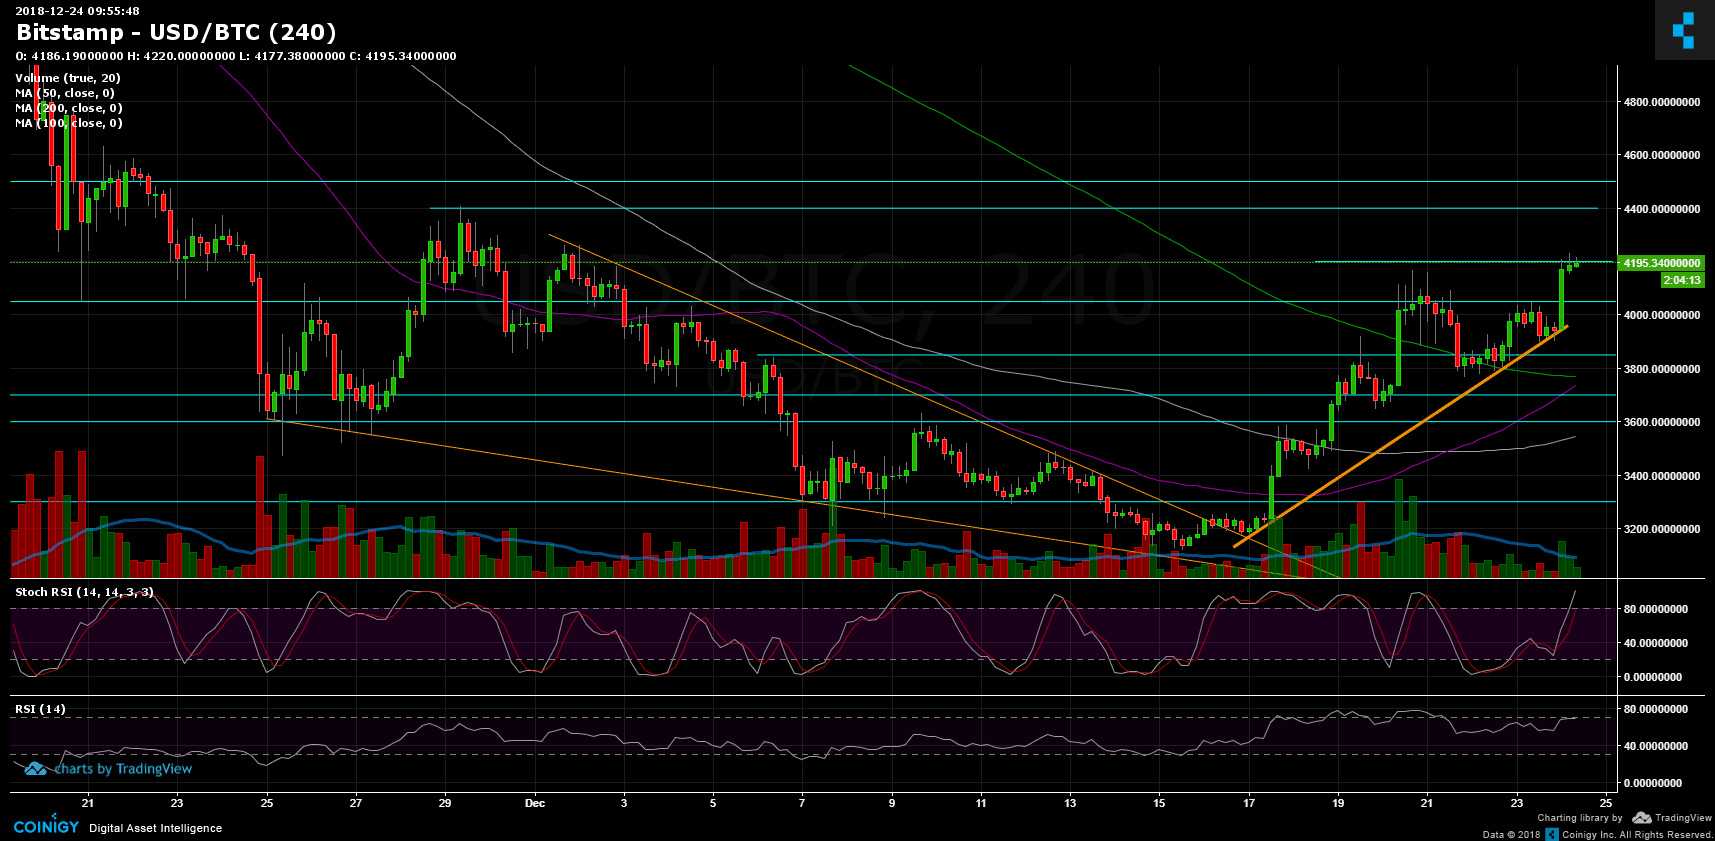
Just a quick update, following the previous update from yesterday. After Bitcoin found support on the descending trend-line (marked orange on the 4-hour chart), we had a nice breakout of the $4050 – $4100 range (finally).
As of writing this, Bitcoin is facing the $4200 resistance area. A breakout here and we can expect Bitcoin to reach the $4400 – $4500 zone.
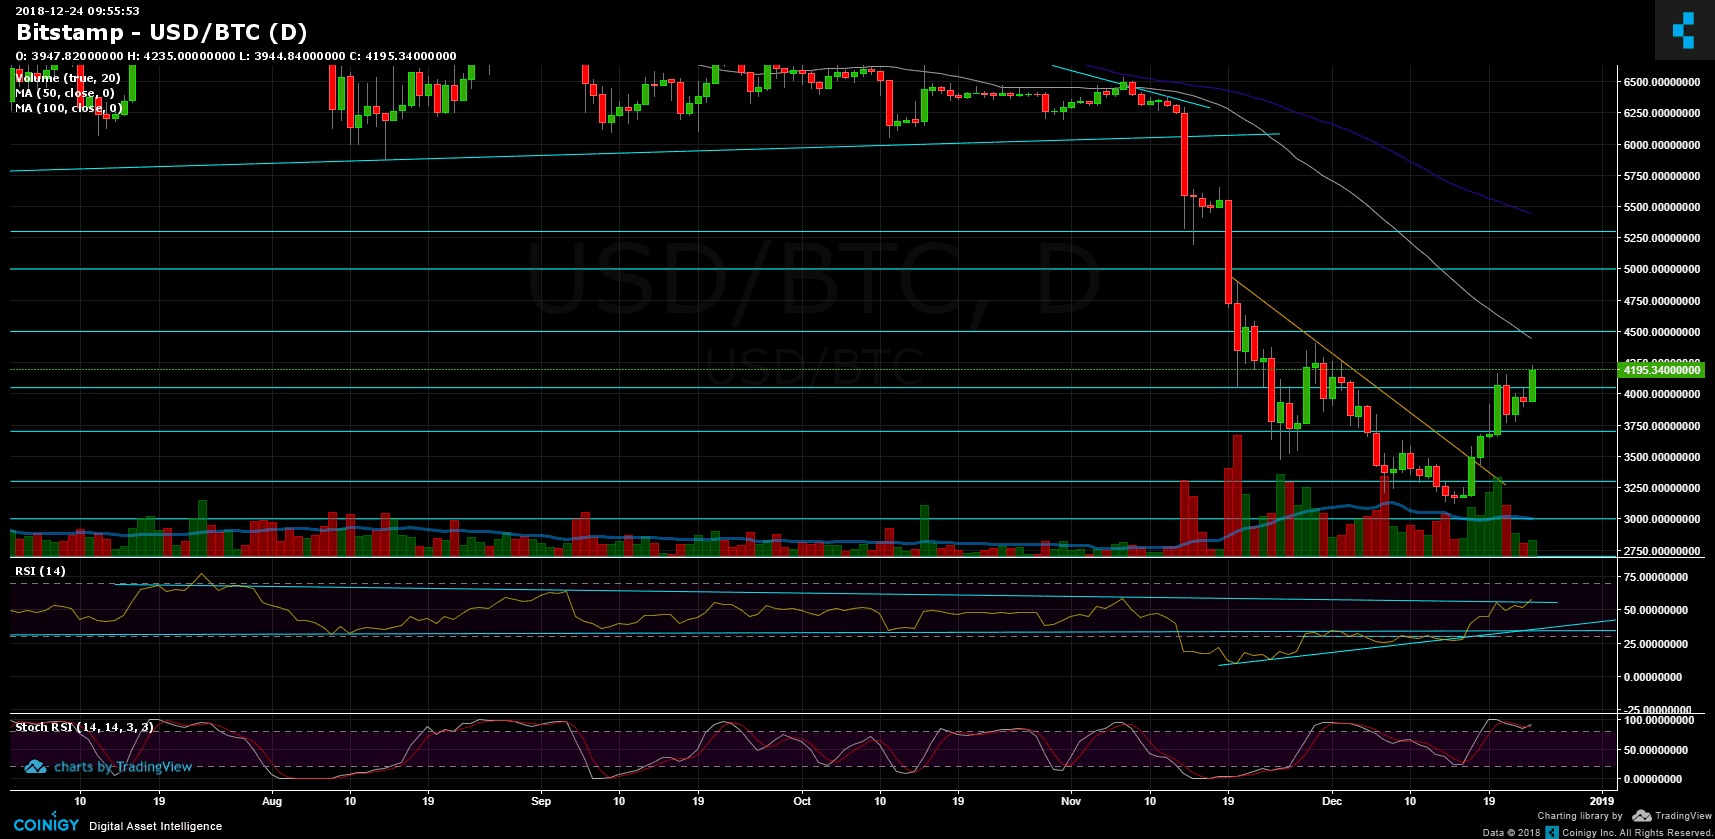
The last is the prior high from the daily chart, along with 50 days moving average line (1-day chart, marked with white).
Looking at the 1-day & 4-hour charts
- From our previous analysis: “As mentioned yesterday, the correction is so far healthy.” So, following a healthy correction and a short consolidation period, Bitcoin is gaining another positive
- Following yesterday’s analysis, the daily chart’s RSI level hadn’t crossed the significant 80 level.
The RSI had broken up a descending trend-line. In case this will turn into a real breakout, it’s a bullish sign for the mid-term.
However, both the hourly and the 4-hour chart’s RSI are very high and might need some air before gaining some more bullish momentum. - From the bull side, resistance lies at $4400 – $4500 (along with the daily chart’s 50-days moving average line – marked in white). The next significant resistance lies around $4650.
- From the bear side, there is the strong resistance-turned support level at $4050 – $4100, behind lies the $3900 and $3850.
- The trading volume is still low. However, it will be interesting to see how the daily candle develops.
- BitFinex’s open short positions had decreased to 33.5K BTC. Remember; when shorts are at their ATH expect a short squeeze. When shorts are at the bottom, expect a long squeeze.
BTC/USD BitStamp 4-Hour chart

BTC/USD BitStamp 1-Day chart

The post Bitcoin Price Analysis Dec.24: Green On The Screen – The Bullish Bitcoin Is Facing $4200 appeared first on CryptoPotato.


