Bitcoin Price Analysis Dec.23: Same Range, Healthy But Fragile
Over the past day, Bitcoin had been trading between $3800 – $4000. As stated on our yesterday’s analysis:
“For the shorter-term, we might see Bitcoin getting closer to the $4000 again, as the 4-hour chart’s Stochastic RSI is about to cross over on the oversold area.”
Bitcoin did revisit the $4000 zone, failing to breach the $4050 – $4100 resistance. The above is a critical level for a chance to re-test prior highs, especially around the $4400 – $4500 area (keep on reading).
Over the past hours, Bitcoin lost momentum, to re-test $3900 prior support. As mentioned before, the 38.2% Fib level of the last bullish move lies around $3800. This was the low of the previous two daily candles. As long as Bitcoin keeps its head above that Fib level, BTC could aim for higher targets.
Looking at the 1-day & 4-hour charts
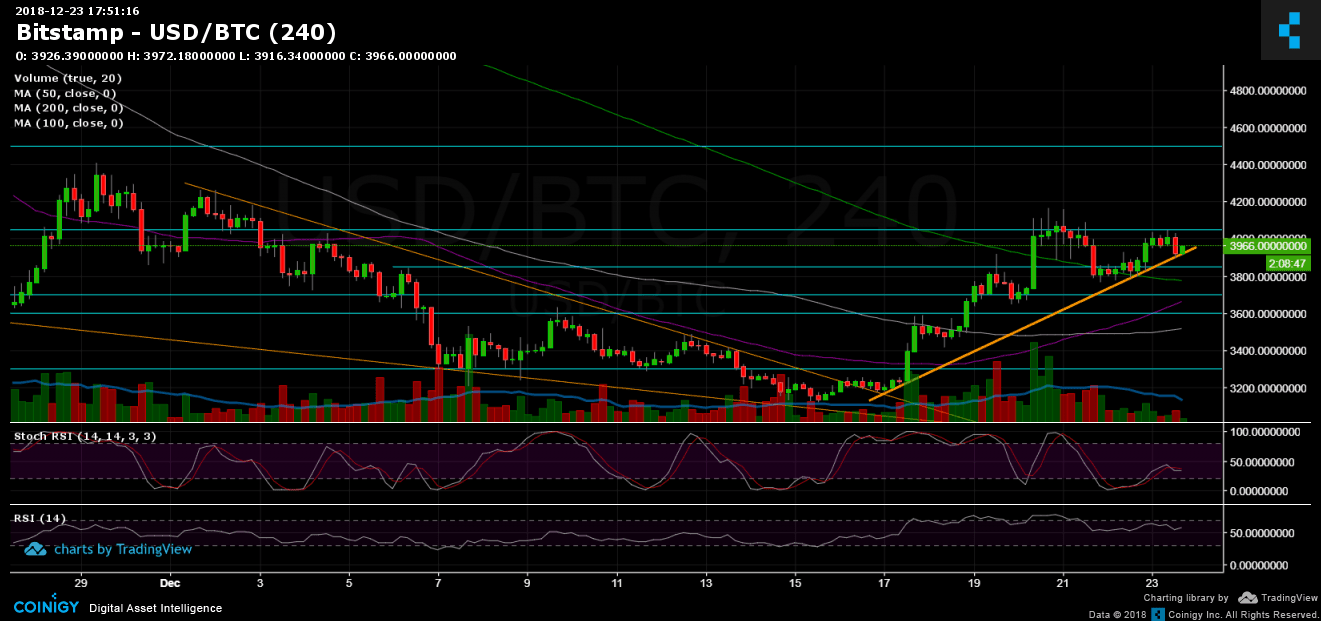
- As of now, Bitcoin found support upon the mid-term descending line (marked orange on the 4-hour chart), along with the 50 and 100 days moving average lines (of the hourly chart, not attached). This seems to be a strong support level.
- In case of breaking down the above support, the next support level is $3850, before the 200 days moving average (4-hour chart, marked in light green) at $3780 – $3800 area. Behind, support lies at $3700 and $3600 areas.
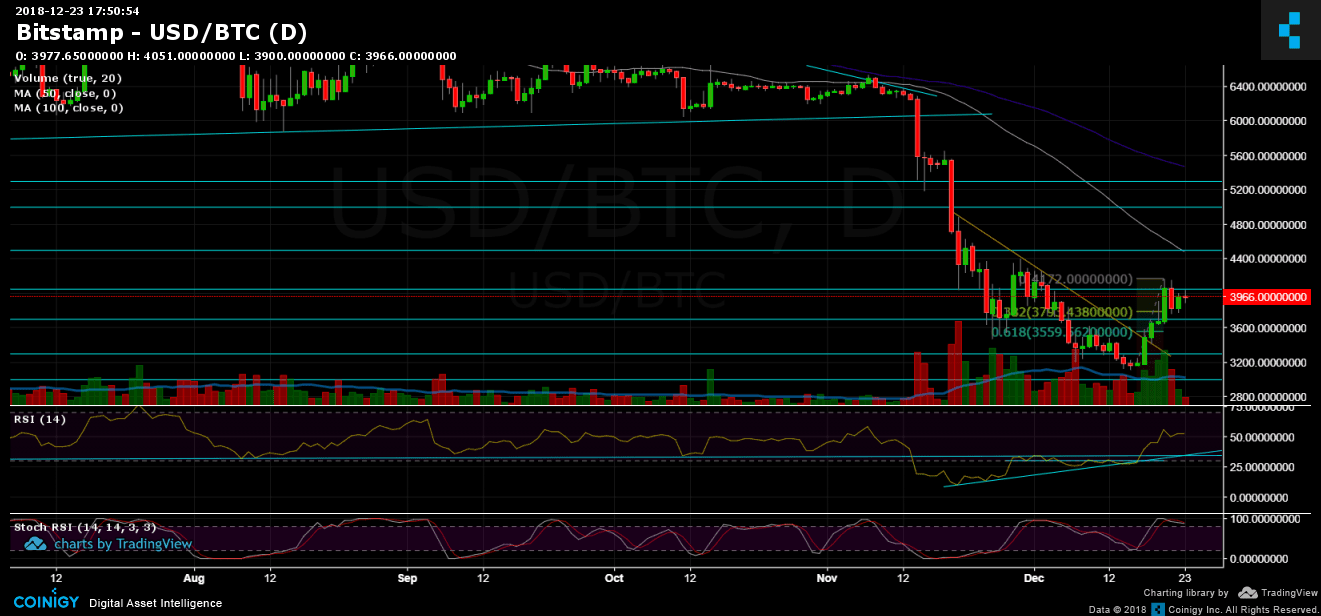
- As mentioned yesterday, the correction is so far healthy (as long as Bitcoin’s price stays above $3800). However, the daily chart’s Stochastic RSI oscillator had crossed over at the overbought level. This could trigger a deeper correction in the coming days. Better watch the RSI level closely.
- From the bull side, resistance lies at $4050 – $4100, $4200, and $4500 (along with the daily chart’s 50-days moving average line – marked white on the chart).
- As a reminder: The $4500 level, along with the daily chart’s MA-50, is a crucial level for a possible change of the longer-term bearish momentum.
- The trading volume is relatively low, as compared to the past days. This could be because of the weekend and holidays.
- BitFinex’s open short positions had decreased to 33.5K BTC. Remember; when shorts are at their peak anticipate a short squeeze. When shorts are at the bottom, expect a long squeeze.
BTC/USD BitStamp 4-Hour chart
BTC/USD BitStamp 1-Day chart
The post Bitcoin Price Analysis Dec.23: Same Range, Healthy But Fragile appeared first on CryptoPotato.