Bitcoin Price Analysis Dec.20: Bitcoin Breaks $4000. What’s Next?
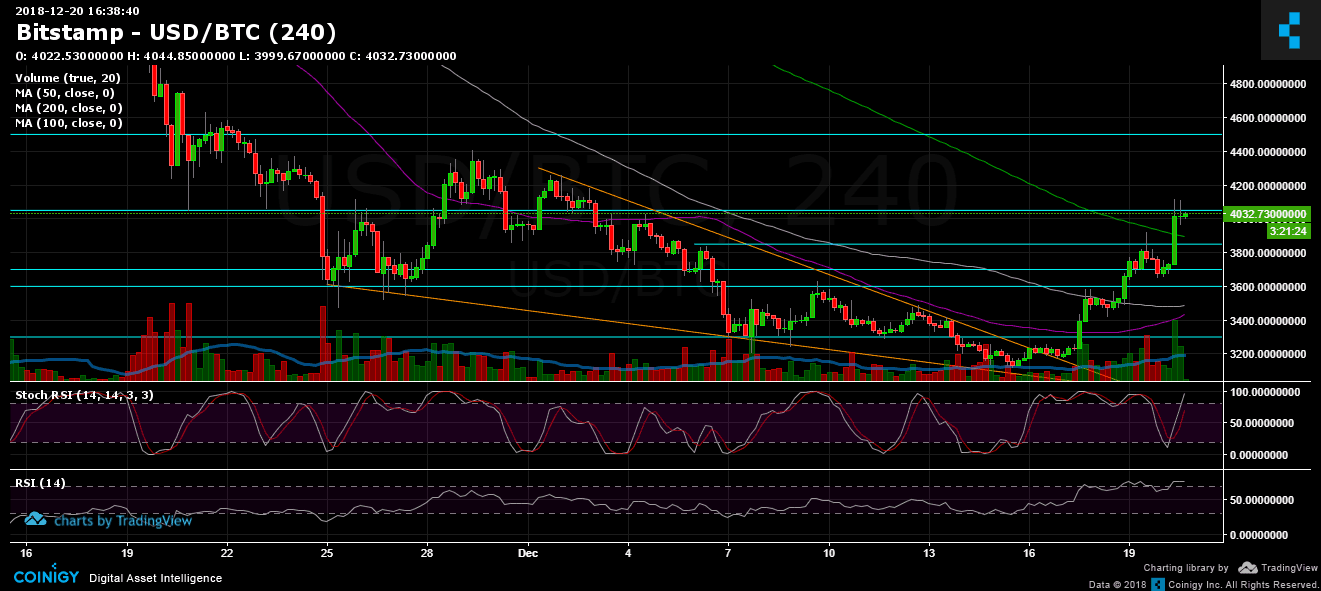
The bulls continue! Since our previous analysis, Bitcoin did have to take some air: As we stated about possible targets for correction, Bitcoin re-tested $3600 area before the bullish rally continued.
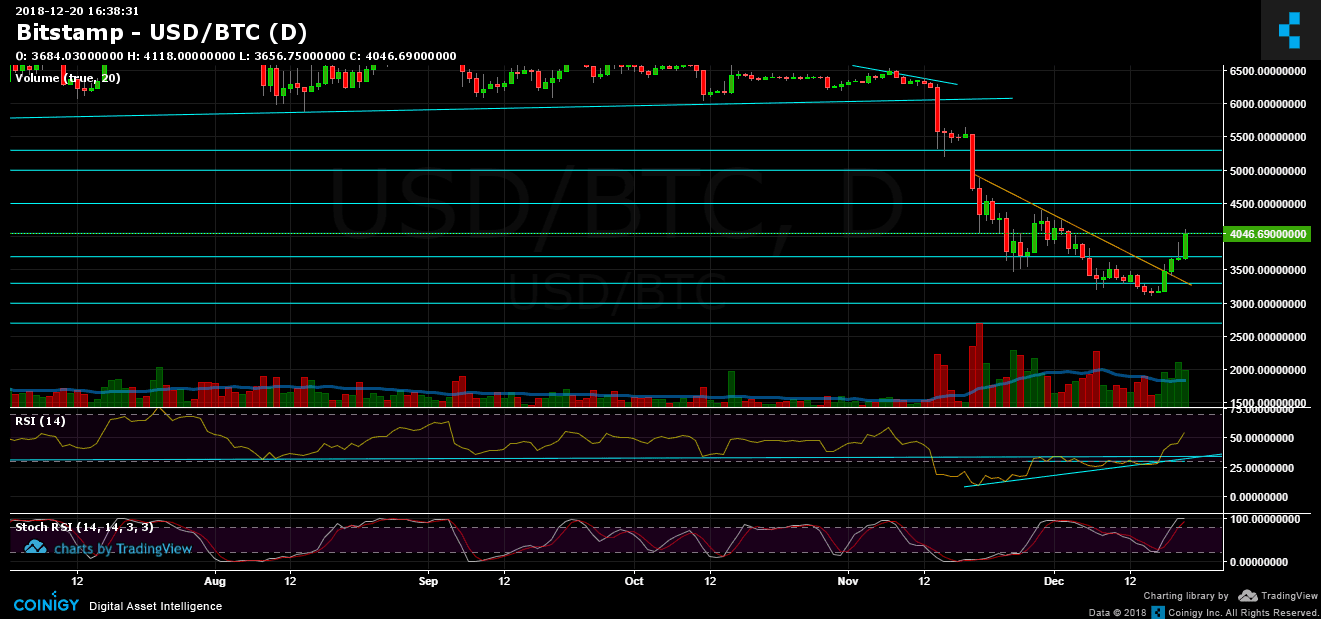
This is from yesterday’s analysis: “Looking at the daily chart: yesterday’s Japanese candle closed very strong and bullish, marking a breakout from the descending trend-line. This is definitely a bullish sign that might grant the market enough fuel to continue to the $3900 – $4000 resistance area.”
Bitcoin recorded nice gains over today’s trading, breaking up the $3850 resistance along with the 200 days moving average line (marked green on the 4-hour chart), topping $4118 on Bitstamp.
However, there is a tough resistance zone around $4050 – $4100. To remind all, this level was the annual low that had broken down only at the third trial on November 24. In technical analysis, levels that were strong as support, had turned to being strong resistance as well.
Looking at the 1-day & 4-hour charts
- As mentioned above, after a decent 30% move in less than three days, Bitcoin encounters the $4050 resistance area. In my opinion, this won’t be easy to breach. Besides, the daily chart’s Stochastic RSI oscillator is about to cross over at the overbought level. This could trigger a correction down (it’s interesting to see that this indicator is usually very accurate – the crossover at the oversold area was ahead of the current $1000 BTC move).
- Possible targets for correction are the following support levels: $3900 (along with the 200 days moving average line), $3850, $3700 and $3600.
- From the bull side, in case of breaking up the $4050 – $4100 resistance area, the next major levels are $4200 and $4400. The last level is the prior local high on the daily chart. This is a critical level for declaring on a mid-term bullishness
- Trading volume: Nice green volume candles followed the last days’ gains. However, the volume is not such as one that supports the option of a reversal, yet said.
- BitFinex’s open short positions had slightly increased to 37.2K BTC open positions. What is very interesting here, like we said before – every time the shorts number is reaching close to the 40K mark, then comes a short squeeze. This is exactly what has happened over the past 24 hours.
BTC/USD BitStamp 4-Hour chart
BTC/USD BitStamp 1-Day chart
Cryptocurrency charts by TradingView. Technical analysis tools by Coinigy.
The post Bitcoin Price Analysis Dec.20: Bitcoin Breaks $4000. What’s Next? appeared first on CryptoPotato.