Bitcoin Price Analysis Dec.2: A Fragile Point Of Decision
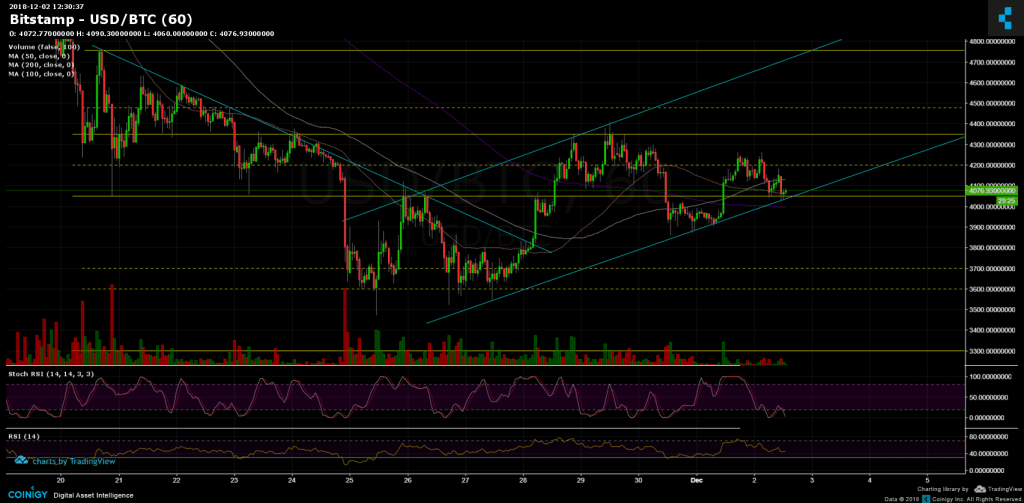
Over the past few days since creating a new annual low, Bitcoin is moving in an ascending channel (looking at the hourly chart). As of now, Bitcoin is near the lower trend-line of the channel, along with the $4000 – $4050 support range. This is a very fragile area, and the bulls hope to get the necessary support here.
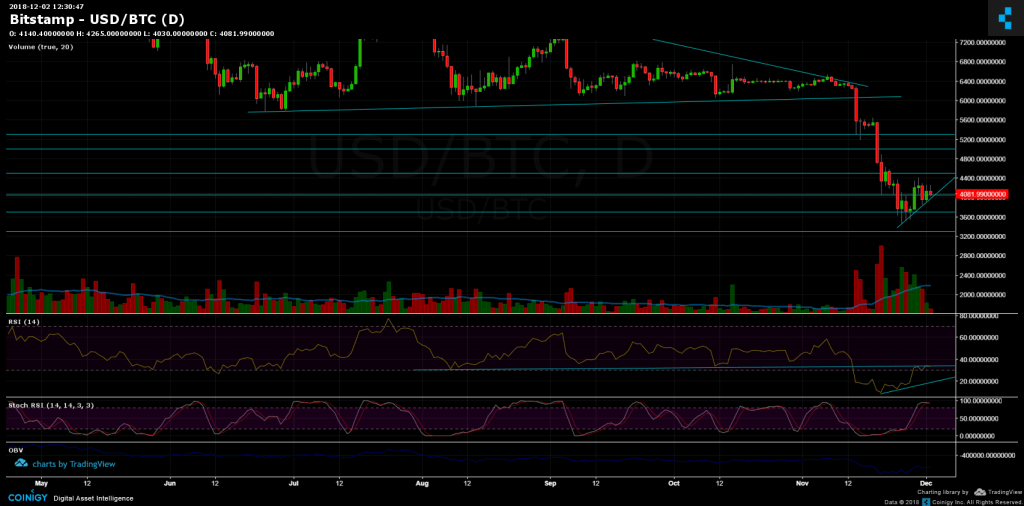
Looking at the bigger picture, on the daily chart, the RSI indicator is still testing the mid-term trend-line as resistance, while the Stochastic RSI oscillator is very close to cross at the overbought area.
Mixed feelings? Kind of. There are those times that are considered harder for trading, in my opinion, this is an excellent example of such. It might be better not to hump on position before clear signs of a break out to either direction.
Looking at the 1-day & 1-hour charts
- The hourly chart’s Stochastic RSI is about to cross at the oversold area. This might indicate a possible correction up. This supports the idea of keeping up the ascending channel formation.
- From the bear side, the next significant support is close by at $4050, along with 50 and 200 days moving average lines (the pink and purple lines in the hourly chart). The next levels lie at $3950, $3800 and $3700, before getting to the yearly low’s area at $3500.
- From the bull side, the next major resistance level lies around $4250, afterward is the $4355, and then the $4500 level. A bullish scenario might send Bitcoin to re-test the higher trend-line of the channel at the $4700 – $4800 area.
- The trading volume is relatively low, typically to weekends.
- BitFinex’s open short positions have slightly decreased to 33.7K.
BTC/USD BitStamp 1-Hour chart

BTC/USD BitStamp 1-Day chart

Cryptocurrency charts by TradingView. Technical analysis tools by Coinigy.
The post Bitcoin Price Analysis Dec.2: A Fragile Point Of Decision appeared first on CryptoPotato.


