Bitcoin Price Analysis Dec.19: Are Bulls Back or Is It a Dead-Cat Bounce?
The green is back on screen: After sad weeks in red, since breaking down the $6,000, finally some days of optimism for the crypto community.
Following yesterday’s analysis: “It looks like Bitcoin has the right keys to continue up, at least to the $3600 – $3700 area: The daily trading volume is the highest of the past week, the RSI indicator looks bullish after breaking up the long-term trend line.”
So after almost reaching $3,600, Bitcoin had to take some air and had made the needed correction to the 38.2% Fibonacci level (~$3430). After hours of consolidation around the strong resistance area of $3450 – $3500, Bitcoin produced a nice green candle topping $3776 on Bitstamp.
Is that a dead-cat bounce and from here the bears will return, or is this the beginning of the reversal?
Looking at the 1-day & 4-hour charts
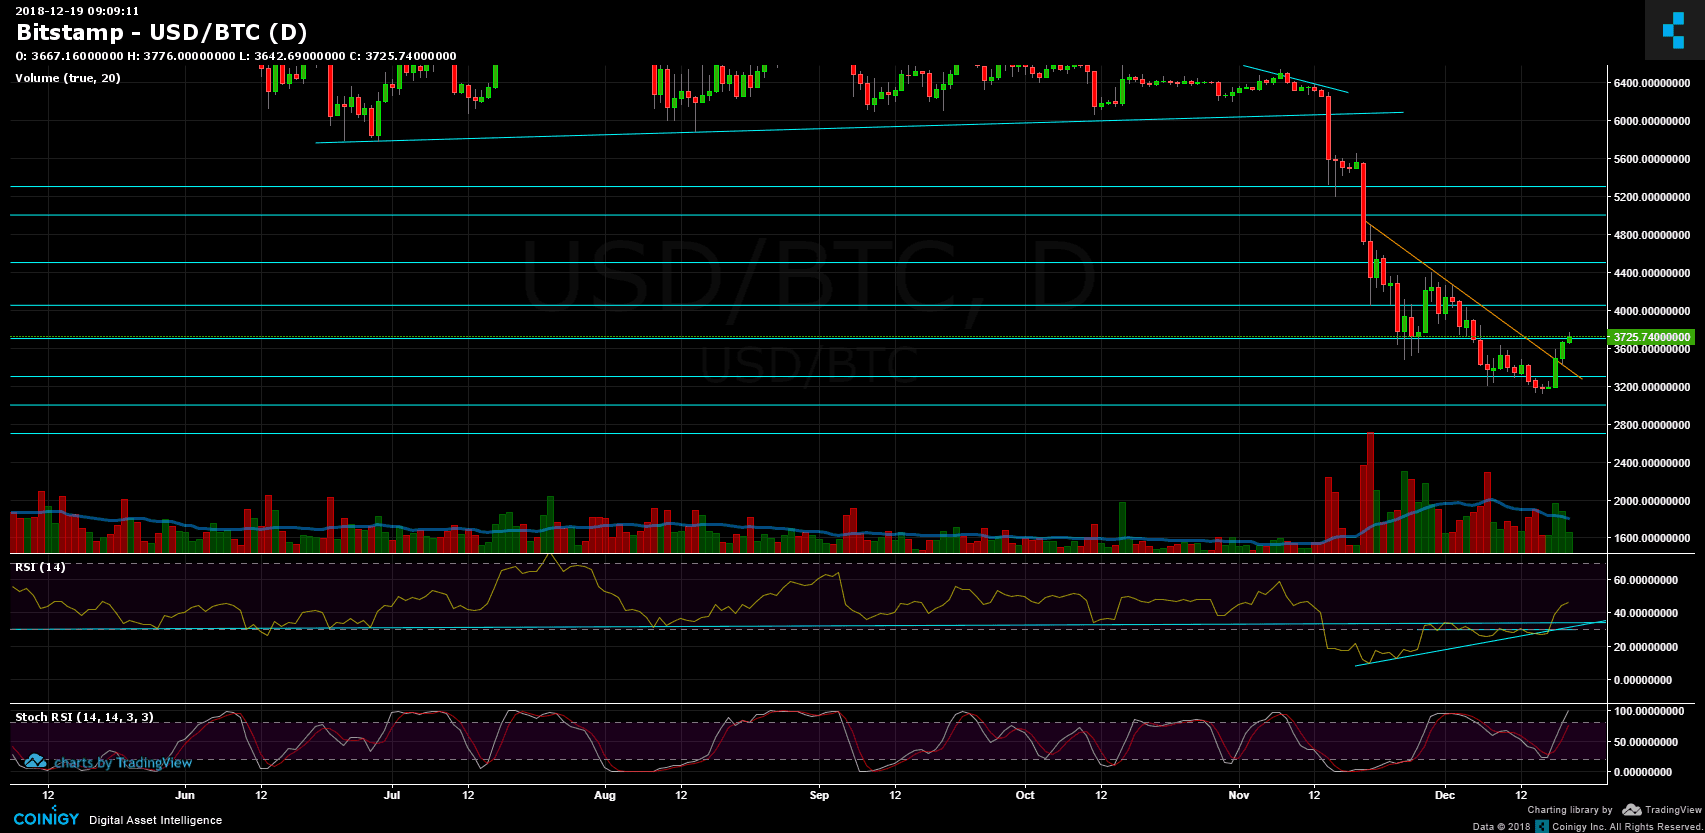
- Looking at the daily chart: yesterday’s Japanese candle closed very strong and bullish, marking a breakout from the descending trend-line. This is definitely a bullish sign that might grant the market enough fuel to continue to the $3900 – $4000 resistance area.
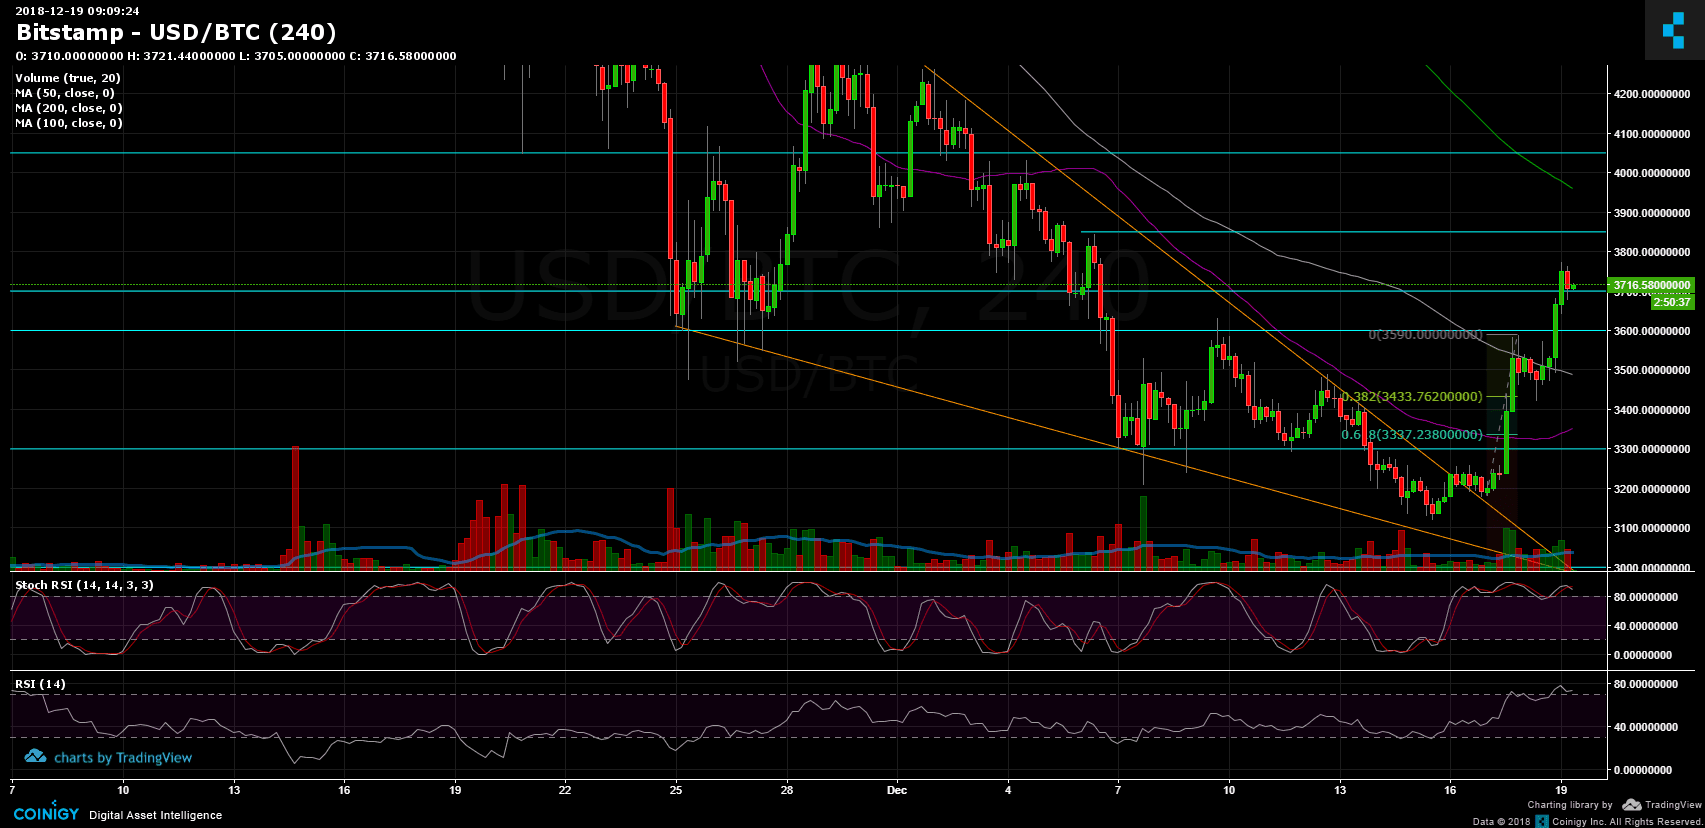
- However, Stochastic RSI oscillator of the 4-hour chart is (again) at its overbought area and crossed over, so a possible correction down to $3600 or $3500 will still consider as a healthy correction to the bullish movement. As of writing this update, Bitcoin is getting supported by the $3700 level.
- From the bullish side, the resistance area lies around $3850 – $3900 before facing the $4000 again.
- A word about trading volume: In a healthy bull market we expect to see rising green candles of volume (along with short red candles of sellers). In other words, as the price goes up, more investors buy in. So far, the bull’s volume isn’t very significant compared to the bear’s volume of the past weeks’ declines. Yesterday’s candle is a little smaller than the day before. It will be interesting to see how today’s candle will develop in a matter of momentum and volume.
- As mentioned before, the critical level for getting a reversal is breaking up the prior high at $4400 and re-testing it as support.
- BitFinex’s open short positions had slightly increased to 36.2K BTC open positions.
BTC/USD BitStamp 4-Hour chart
BTC/USD BitStamp 1-Day chart
Cryptocurrency charts by TradingView. Technical analysis tools by Coinigy.
The post Bitcoin Price Analysis Dec.19: Are Bulls Back or Is It a Dead-Cat Bounce? appeared first on CryptoPotato.