Bitcoin Price Analysis Dec.15: New annual low, the $3000 target is much closer
In our previous price analysis from two days ago, we mentioned that Bitcoin is testing the $3200 annual low for the third time in a week.
As expected, the support didn’t hold this time, and BTC had discovered a new record low. As of writing this update, the current low stands on $3122 (Bitstamp).
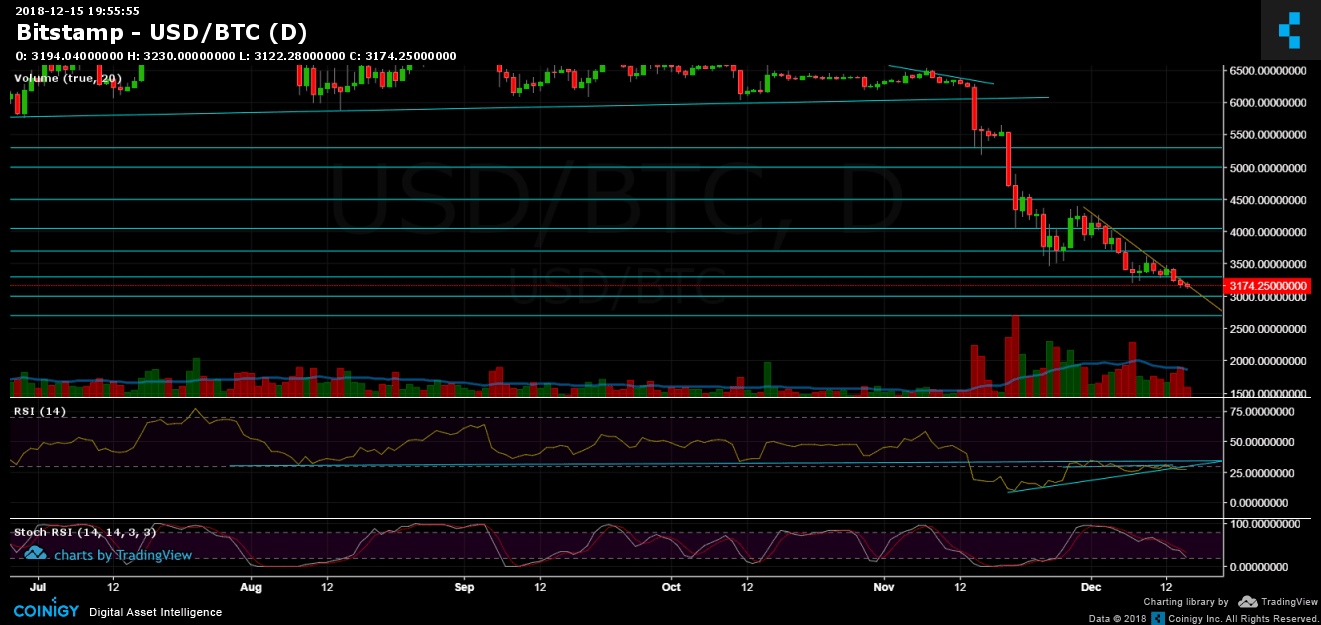
This brings the price of Bitcoin one step closer to our predicted target at $2700 – $3000, which was written about a month ago when Bitcoin was over $6000.
Looking at the 1-day & 4-hour charts
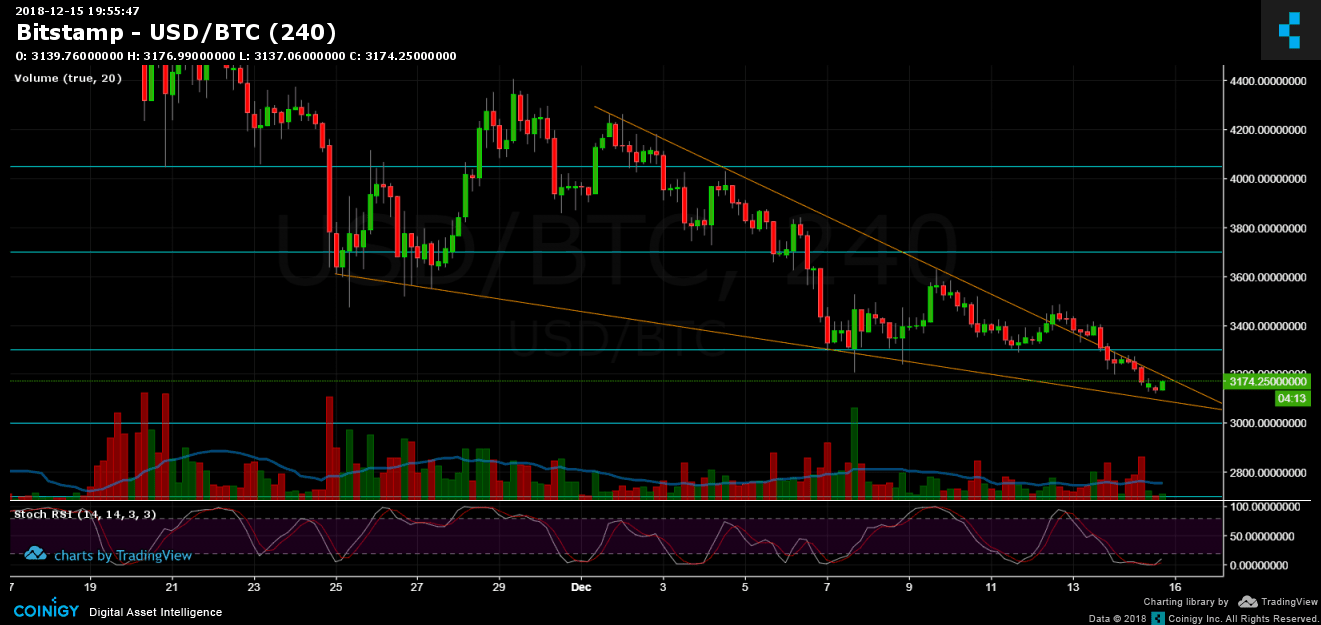
- Bitcoin is forming a falling wedge pattern: This kind of wedge is usually a bullish formation. However, considering the bearish momentum Bitcoin is paving through, the direction of the breakout is very unclear. We should expect a breakout during the next 1-2 days.
- The positive scenario could be a test of the wedge’s bottom close to the legendary $3000 area, before bouncing back and breaking up the wedge.
- In case of a break up: $3200 had turned to be the next resistance, whereas the following possible bounce levels are $3300 and $3400.
- A bearish breakdown is likely to send Bitcoin to test good old levels: $3000, $2900 and $2700.
- Looking at the daily chart’s RSI: As of now, the significant ascending line support seems to have broken down. The next hours will be critical.
- Stochastic RSI oscillator of the daily chart is at its low, while the one of the 4-hour chart had just crossed up. The market is oversold and might need some air (correction).
- The daily trading volume is low. This is reasonable and typical to weekends.
- BitFinex’s open short positions had increased to 38,700 BTC open positions.
BTC/USD BitStamp 4-Hour chart

BTC/USD BitStamp 1-Day chart

Cryptocurrency charts by TradingView. Technical analysis tools by Coinigy.
The post Bitcoin Price Analysis Dec.15: New annual low, the $3000 target is much closer appeared first on CryptoPotato.


