Bitcoin Price Analysis Dec.13: Bitcoin Is Facing It’s Lowest Price Since September 2017
In our yesterday BTC price analysis, we talked about a strong move which was anticipated.
Bitcoin was encountering resistance at the mid-term descending trend-line (as can be seen on the hourly chart). The bullish breakout had turned out to be fake, not been followed by a decent amount of trading volume.
The false breakout had resulted in the sharp move down we are witnessing now. During the past hour and as of writing this update, Bitcoin had touched the annual low at around $3200 (Bitstamp).
Looking at the 1-day & 1-hour charts
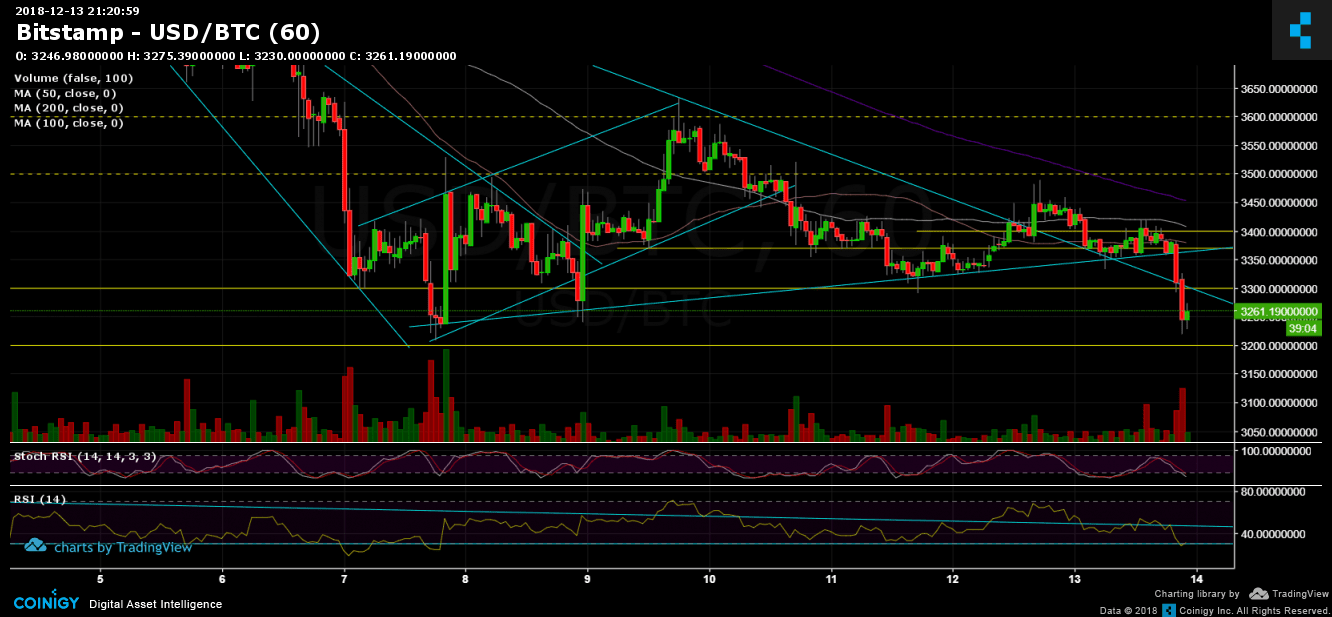
- Looking at the 1-hour chart: after losing support of the 100 days moving average line (the line had been tested as resistance from below), and then dropping below the 50 days moving average line (and again – been tested as a resistance), Bitcoin broke down the ascending trend-line and the mid-term descending trend-line.
- Bitcoin is now facing the annual low, around $3200, for the third time during the past week. As a reminder, the more times a support level is being tested, the higher the chances of a breakdown.
- I won’t be surprised to see Bitcoin discovering new lows soon: The next support lies at $3100, before the mental support level at $3000. Behind is the $2850 – $2900 support area.
- On the less likely scenario of a triple bottom (a bullish pattern), all the last broken support levels had turned to be resistance. This includes $3300 (along with the descending line), $3380 (along with the ascending line) and the $3500 price area.
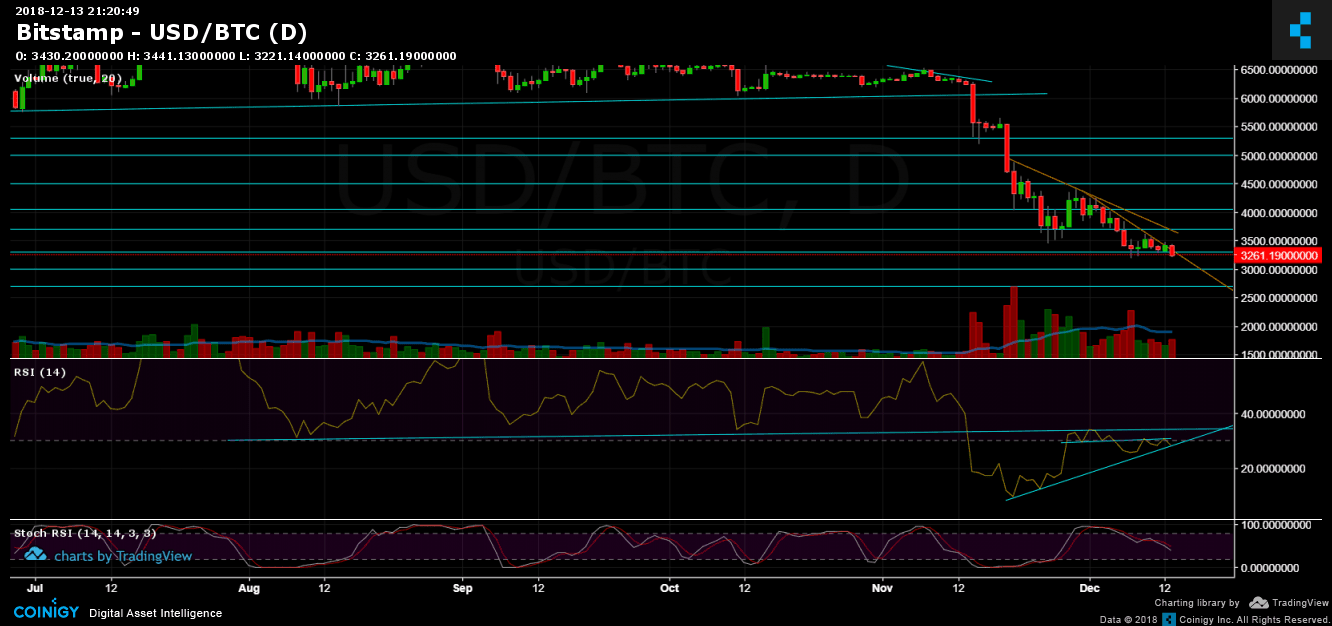
- The RSI indicator: In both the hourly and the daily charts, there is a major RSI support area. Breaking down the support level could indicate on a more profound move down.
- The daily trading volume is still low; this could be explained due to the fact in which most of today was pretty calm (till the recent few hours).
- BitFinex’s open short positions had a slight decrease to 36,300 BTC of open positions.
BTC/USD BitStamp 1-Hour chart
BTC/USD BitStamp 1-Day chart
Cryptocurrency charts by TradingView. Technical analysis tools by Coinigy.
The post Bitcoin Price Analysis Dec.13: Bitcoin Is Facing It’s Lowest Price Since September 2017 appeared first on CryptoPotato.