Bitcoin Price Analysis Dec.12: Range is tightening, a major move is nearby
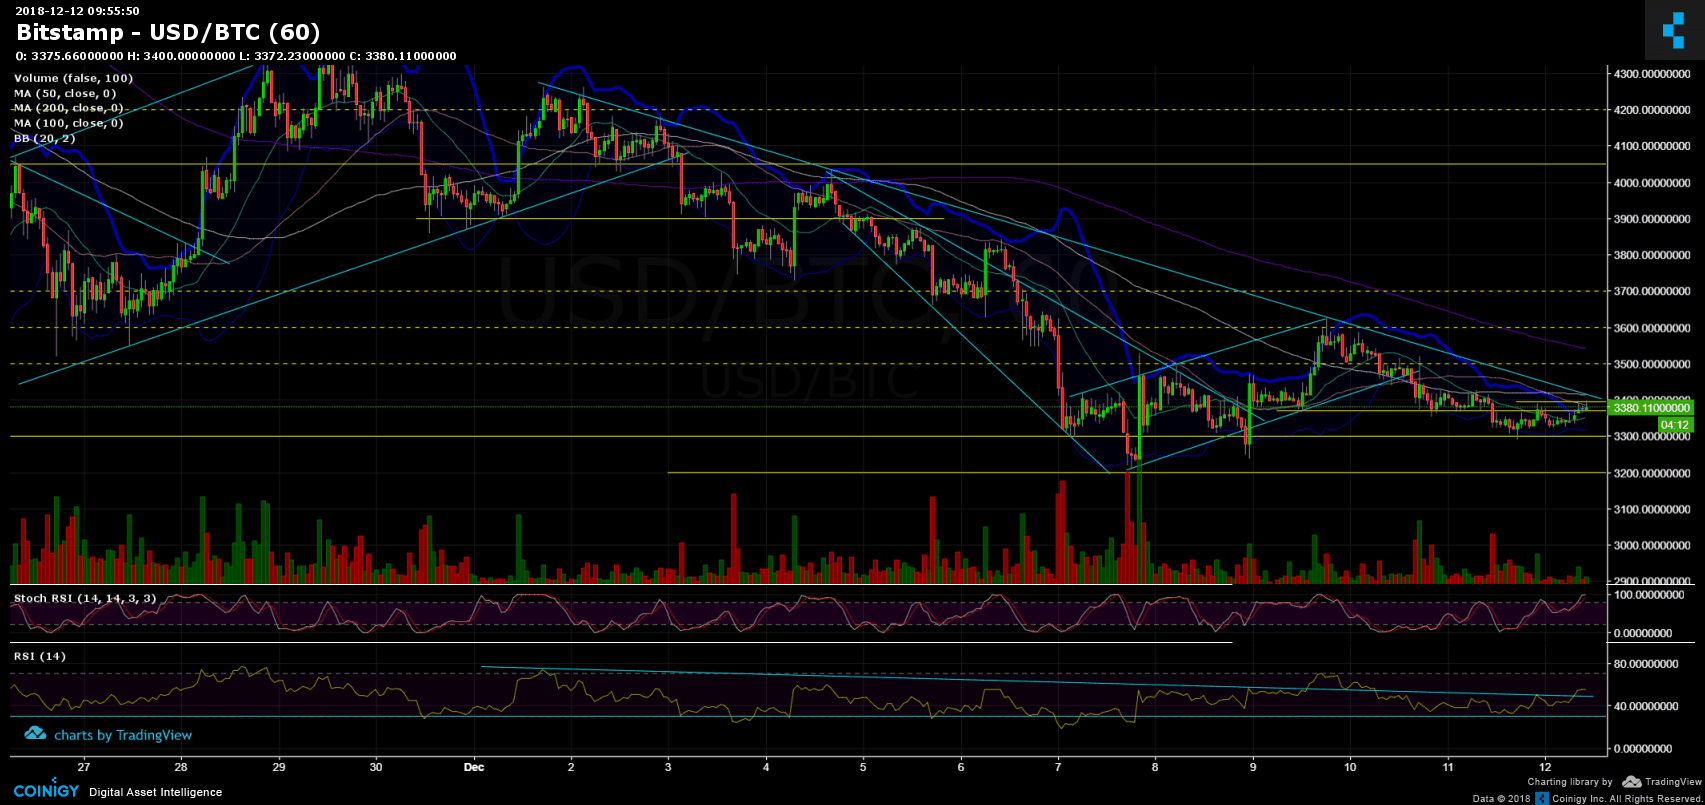
Following yesterday’s analysis, whereas Bitcoin was consolidating in a tight range, the current situation is pretty much the same: For the past two days or so, Bitcoin is consolidating between $3330 and $3430.
As we know from the recent weeks (since breaking down the $6000 support), Bitcoin doesn’t like to consolidate for a long term. Hence, I do expect a significant move soon.
Bollinger Bands support this as well: By looking on the hourly chart, the bands are at their tiniest spread since December 1. As a reminder, this led to a significant move from $3900 to $4270.
Is the move we are expecting going to be positive again? Let’s see.
Looking at the 1-day & 1-hour charts
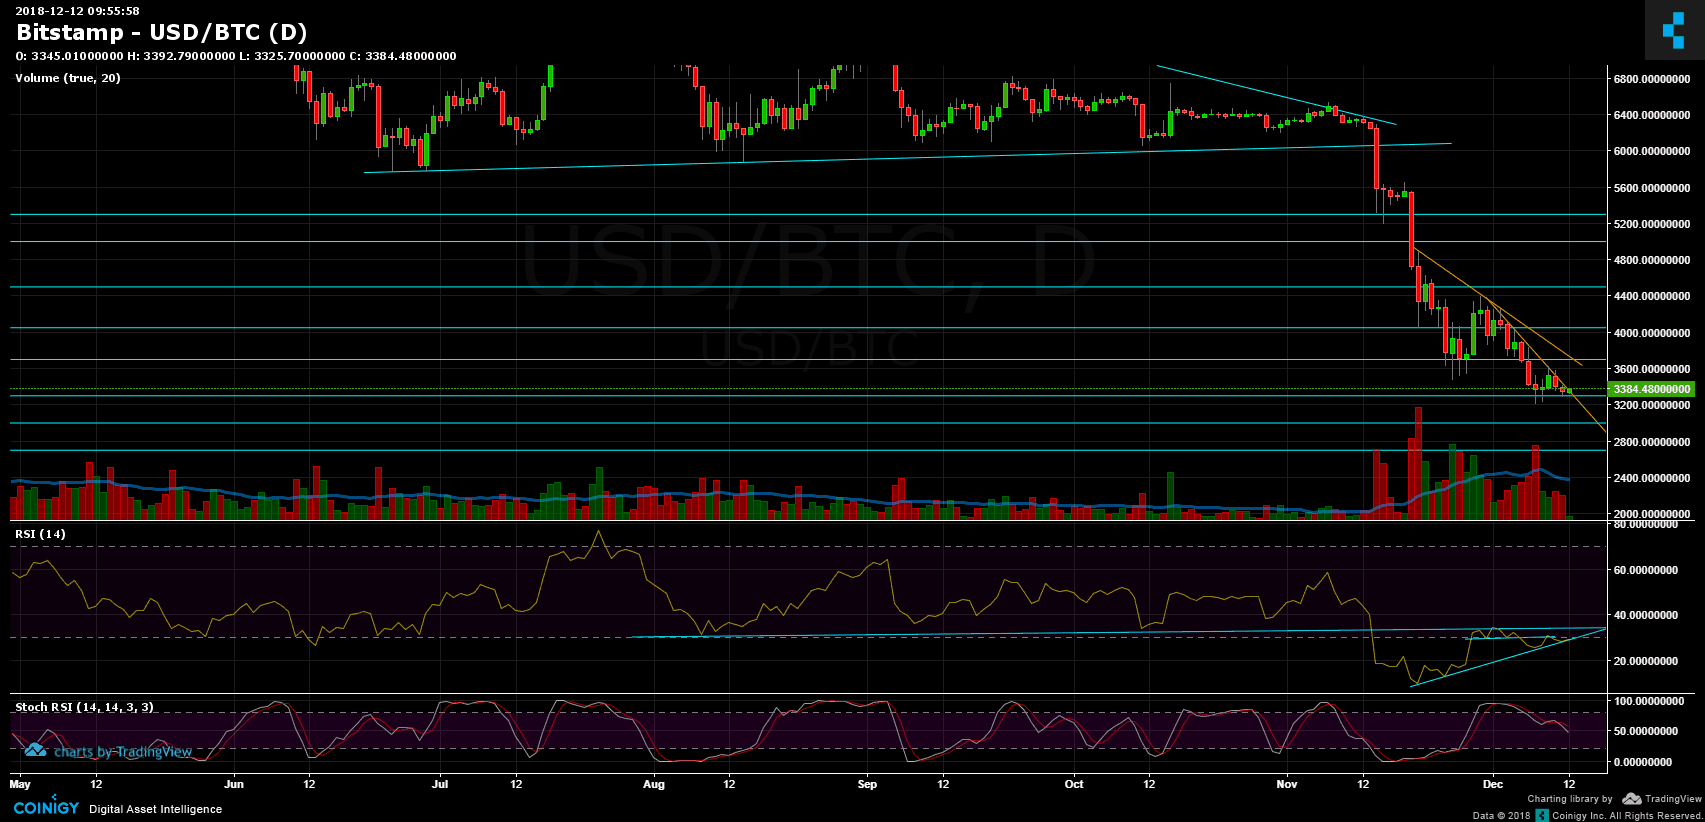
- On both the hourly and the daily chart we could see that Bitcoin is encountering a major descending trend-line that was initialized around $4270 two weeks ago. This is a decision point.
- The RSI of the daily chart is reaching support on the ascending trend-line, a decision point number 2.
- For the short term, The Stochastic RSI of the hourly is reaching the overbought area. The market will need some air before a possible continue upward.
- Bitcoin is now facing the 50 days MA support-turned resistance line (the pink line), along with the descending trend-line mentioned above.
- For the bulls, behind the 50 MA, lies the 100 MA resistance (the white line, both around $3400), the next resistance is at $3500 level (along with the 200 days MA – the purple line) before reaching the $3600 – 3630 resistance area.
- From the bear side – the closest support is nearby: $3350 – $3370. Below is the $3300 and $3200 level, which is also the annual low.
- The trading volume is low compared to the past two weeks, in anticipation of a big move.
- BitFinex’s open short positions had a slight increase to 37,000 BTC of open positions.
BTC/USD BitStamp 1-Hour chart
BTC/USD BitStamp 1-Day chart
Cryptocurrency charts by TradingView. Technical analysis tools by Coinigy.
The post Bitcoin Price Analysis Dec.12: Range is tightening, a major move is nearby appeared first on CryptoPotato.


