Bitcoin Price Analysis: Crucial Moment For BTC After Closing Under 150-Day Support, Bear Market Inbound?
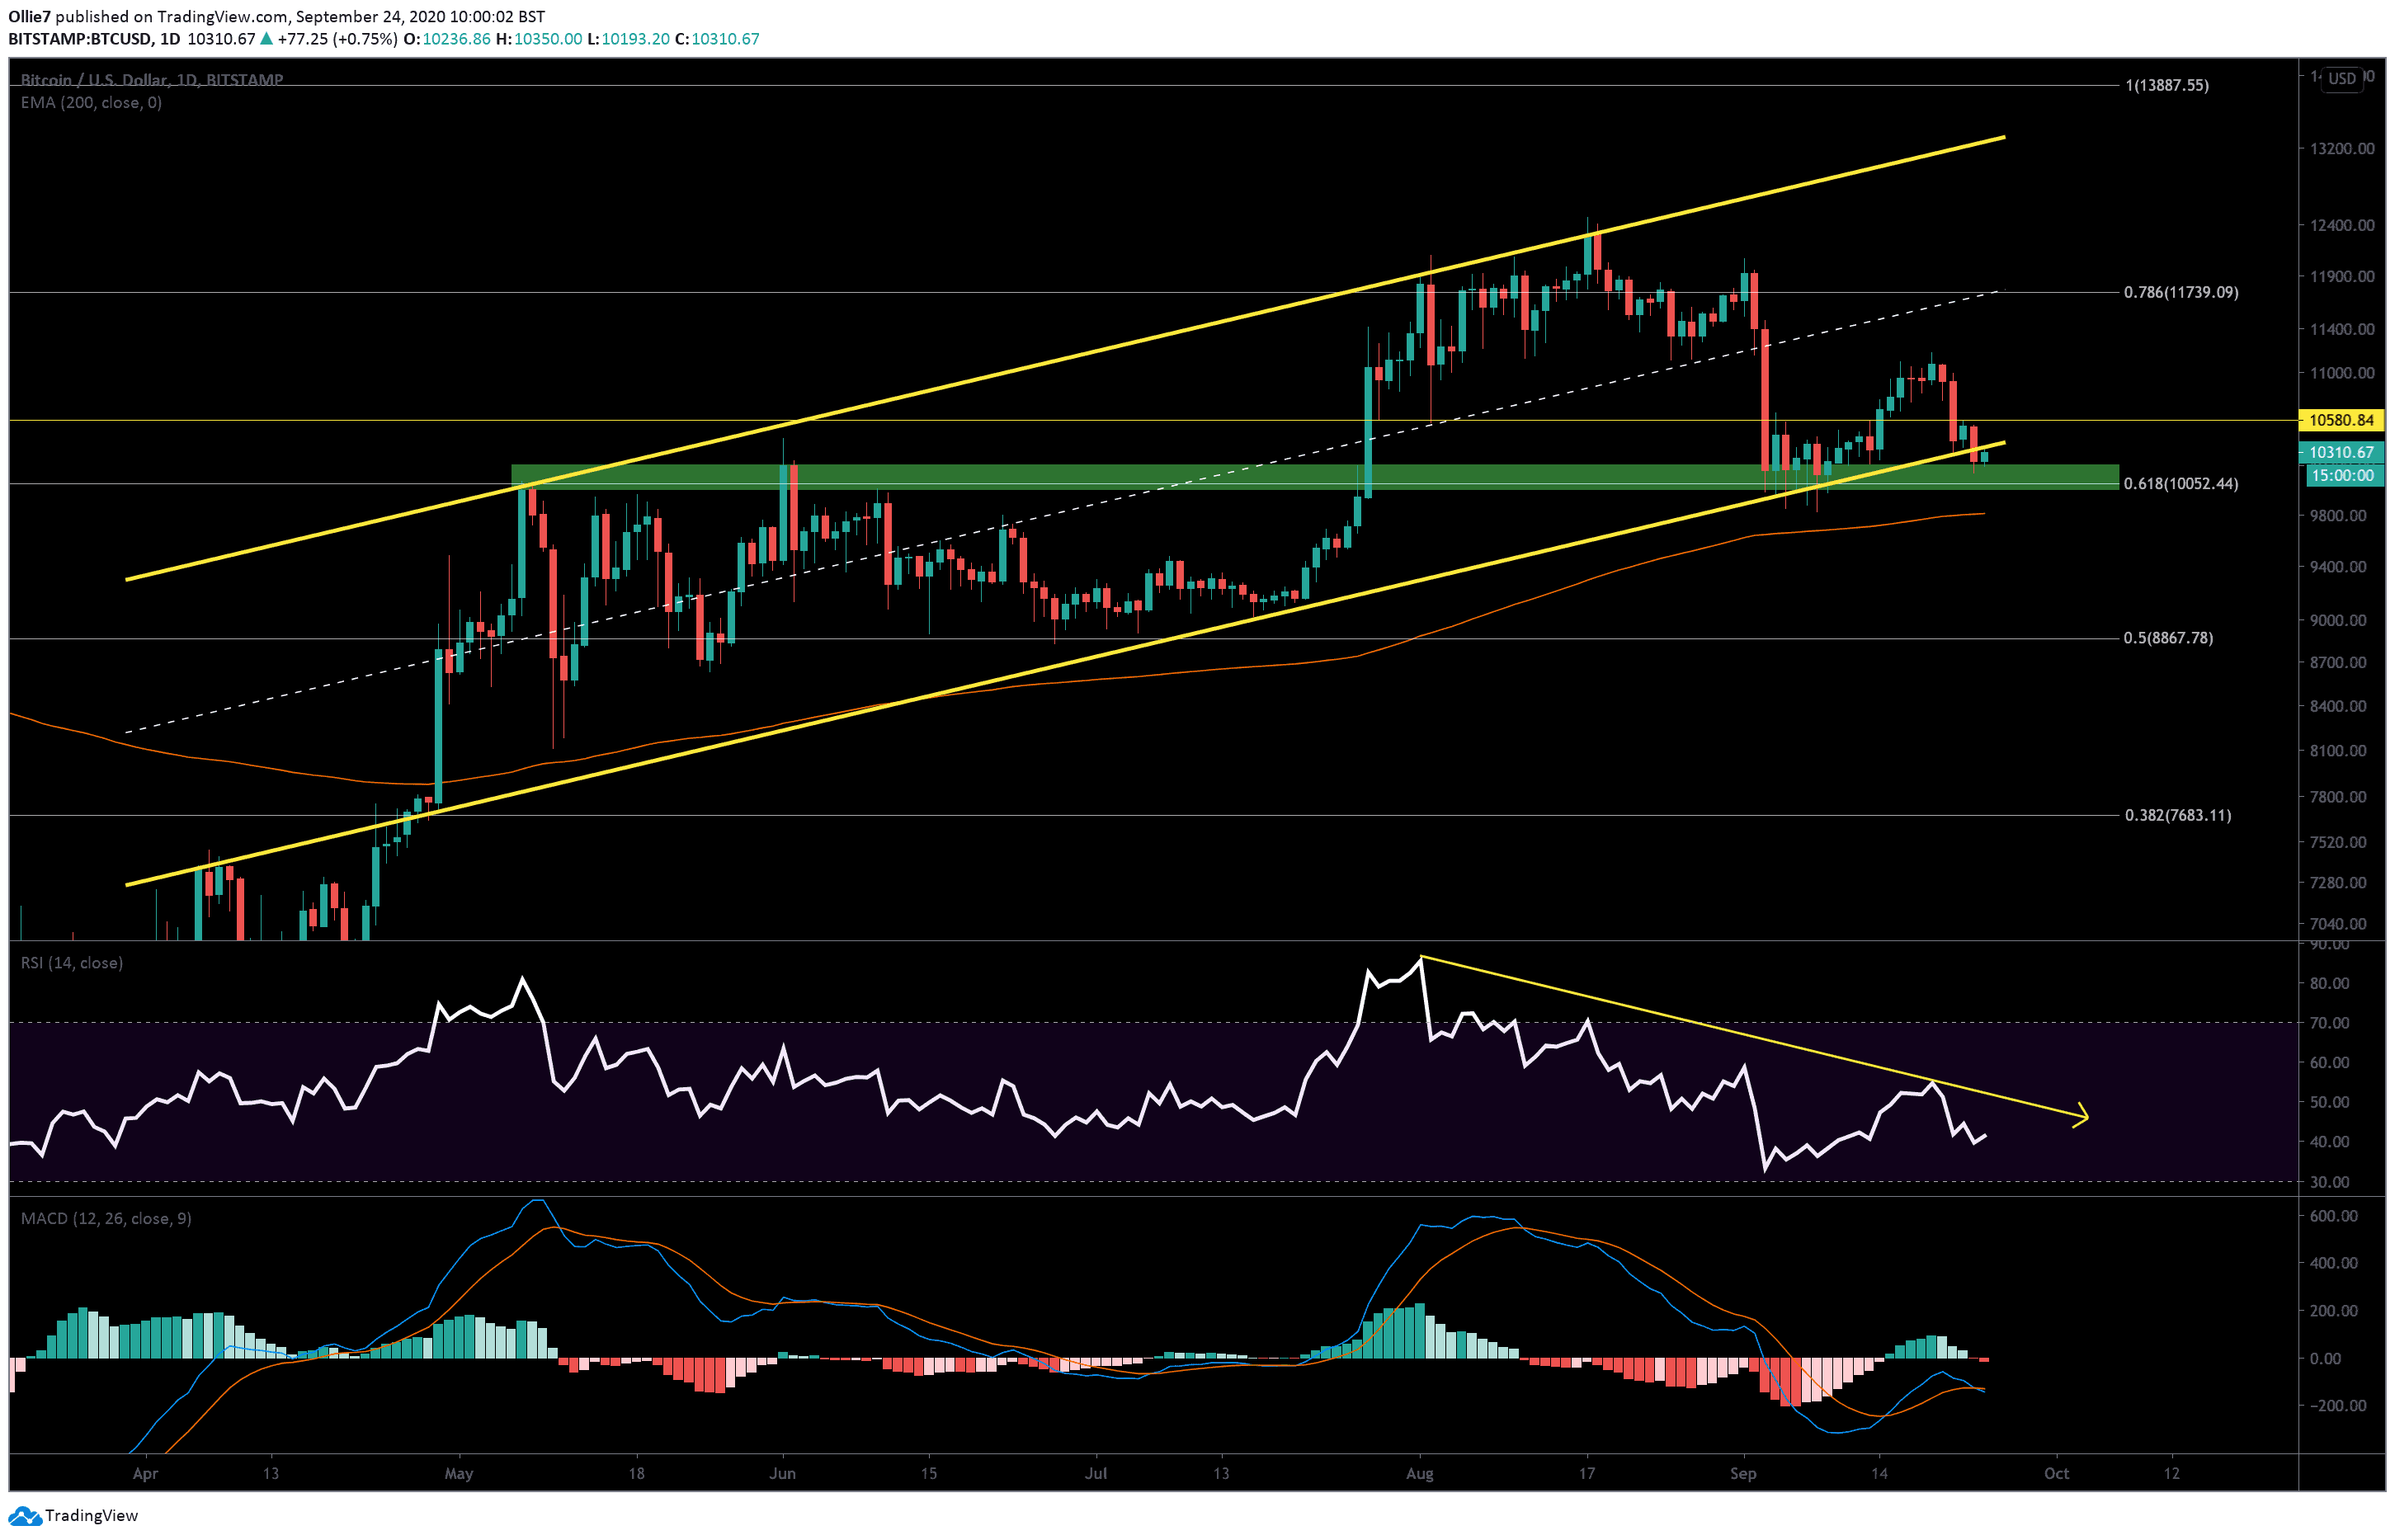
Bitcoin’s price has just closed underneath the primary channel support (yellow line) on the daily chart for the first time since April 26, 2020 – over 151 days ago.
This could spell doom for the leading crypto’s short to mid-term prospects unless significant bullish volume arrives to drive BTC back into the up-trending channel.
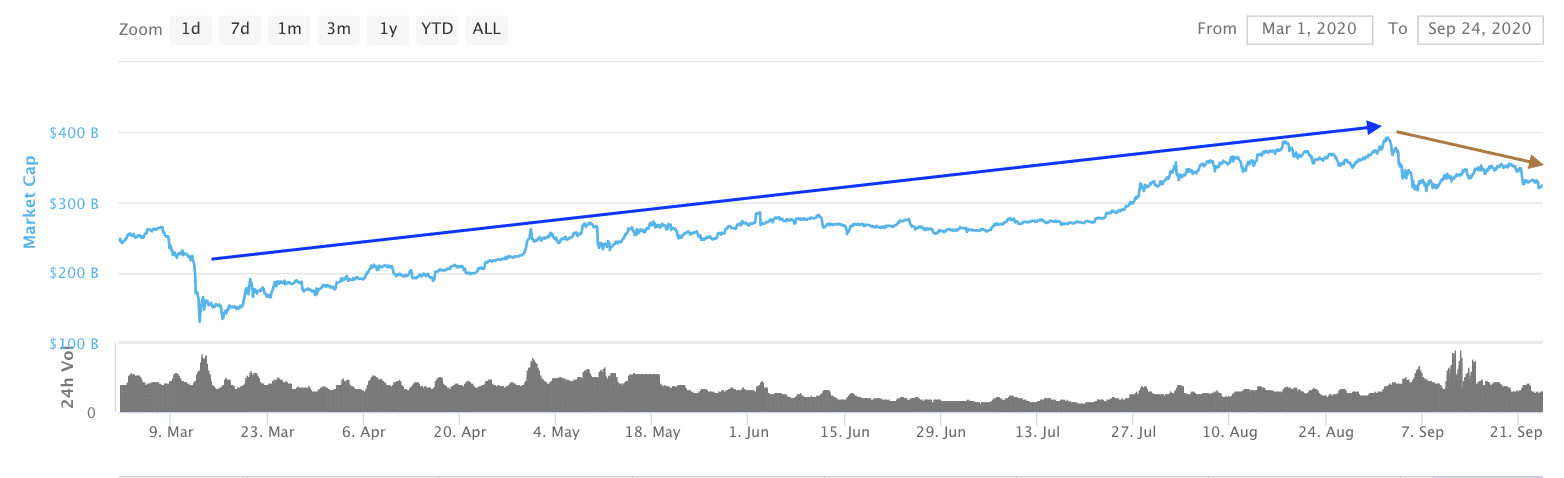
According to data by Coinmarketcap, the global crypto market cap has also fallen back under $325 billion and set a new lower high for the first time since the extreme Coronavirus crash in March 2020 (see red arrow). This is usually a strong indication that the market has now turned favorably bearish.
BTC Price Levels to Watch in the Short-term
On the daily BTC/USD chart, we can see that the price is hovering above the critical support-resistance zone (green) at around $10,200 – $10,000.
This particular area is also reinforced by the 0.618 Fibonacci level, which previously acted as a strong resistance for Bitcoin back in May and June this year.
Bullish traders are currently using this solid foothold to attempt a re-entry back into the main channel above $10,380.
This is a crucial moment for BTC. Failing to break this resistance will likely result in a lack of confidence in the leading asset and further downside towards $10,000 and even the unfilled CME gap below at $9,665 – $9,925.
If this does happen, the 200-EMA (red line) at $9,800 will likely be one of the first supports to help slow down the decline. From there, the bottom of the CME gap at $9,665 should also provide a rebound opportunity for bulls once it finally closes. Other supports lower down can be found at $9,160 and the 0.5 Fibonacci level at $8,867.
The daily RSI adds further confirmation that Bitcoin’s price will likely continue to decline. There’s been a noticeable divergence between the price action and the RSI since August 1 (yellow arrow on RSI), which usually indicates that the trend is weakening. The daily MACD is also decidedly bearish, with selling volume appearing on the histogram as well as a bearish divergence between the 12 and 24 moving averages.
Total market capital: $329 billion
Bitcoin market capital: $190 billion
Bitcoin dominance: 57.9%
*Data by Coingecko.
Bitstamp BTC/USD Daily Chart
The post Bitcoin Price Analysis: Crucial Moment For BTC After Closing Under 150-Day Support, Bear Market Inbound? appeared first on CryptoPotato.