Bitcoin Price Analysis: Consolidation Nears its End as BTC Prepares for New All-Time High
Bitcoin’s price has been consolidating around its all-time high over the last few days following a massive surge of over 30%.
As things currently stand, the bull run is seemingly not over yet.
Technical Analysis
By Edris Derakhshi (TradingRage)
The Daily Chart
On the daily chart, the asset has been rallying aggressively since breaking above the $74K level. Currently, the market is struggling to get past the $92K mark, as the RSI is also showing an overbought state.
Yet, as the market structure suggests, it could only be a matter of time before BTC trades above $100,000, the long-term target for many investors over recent years.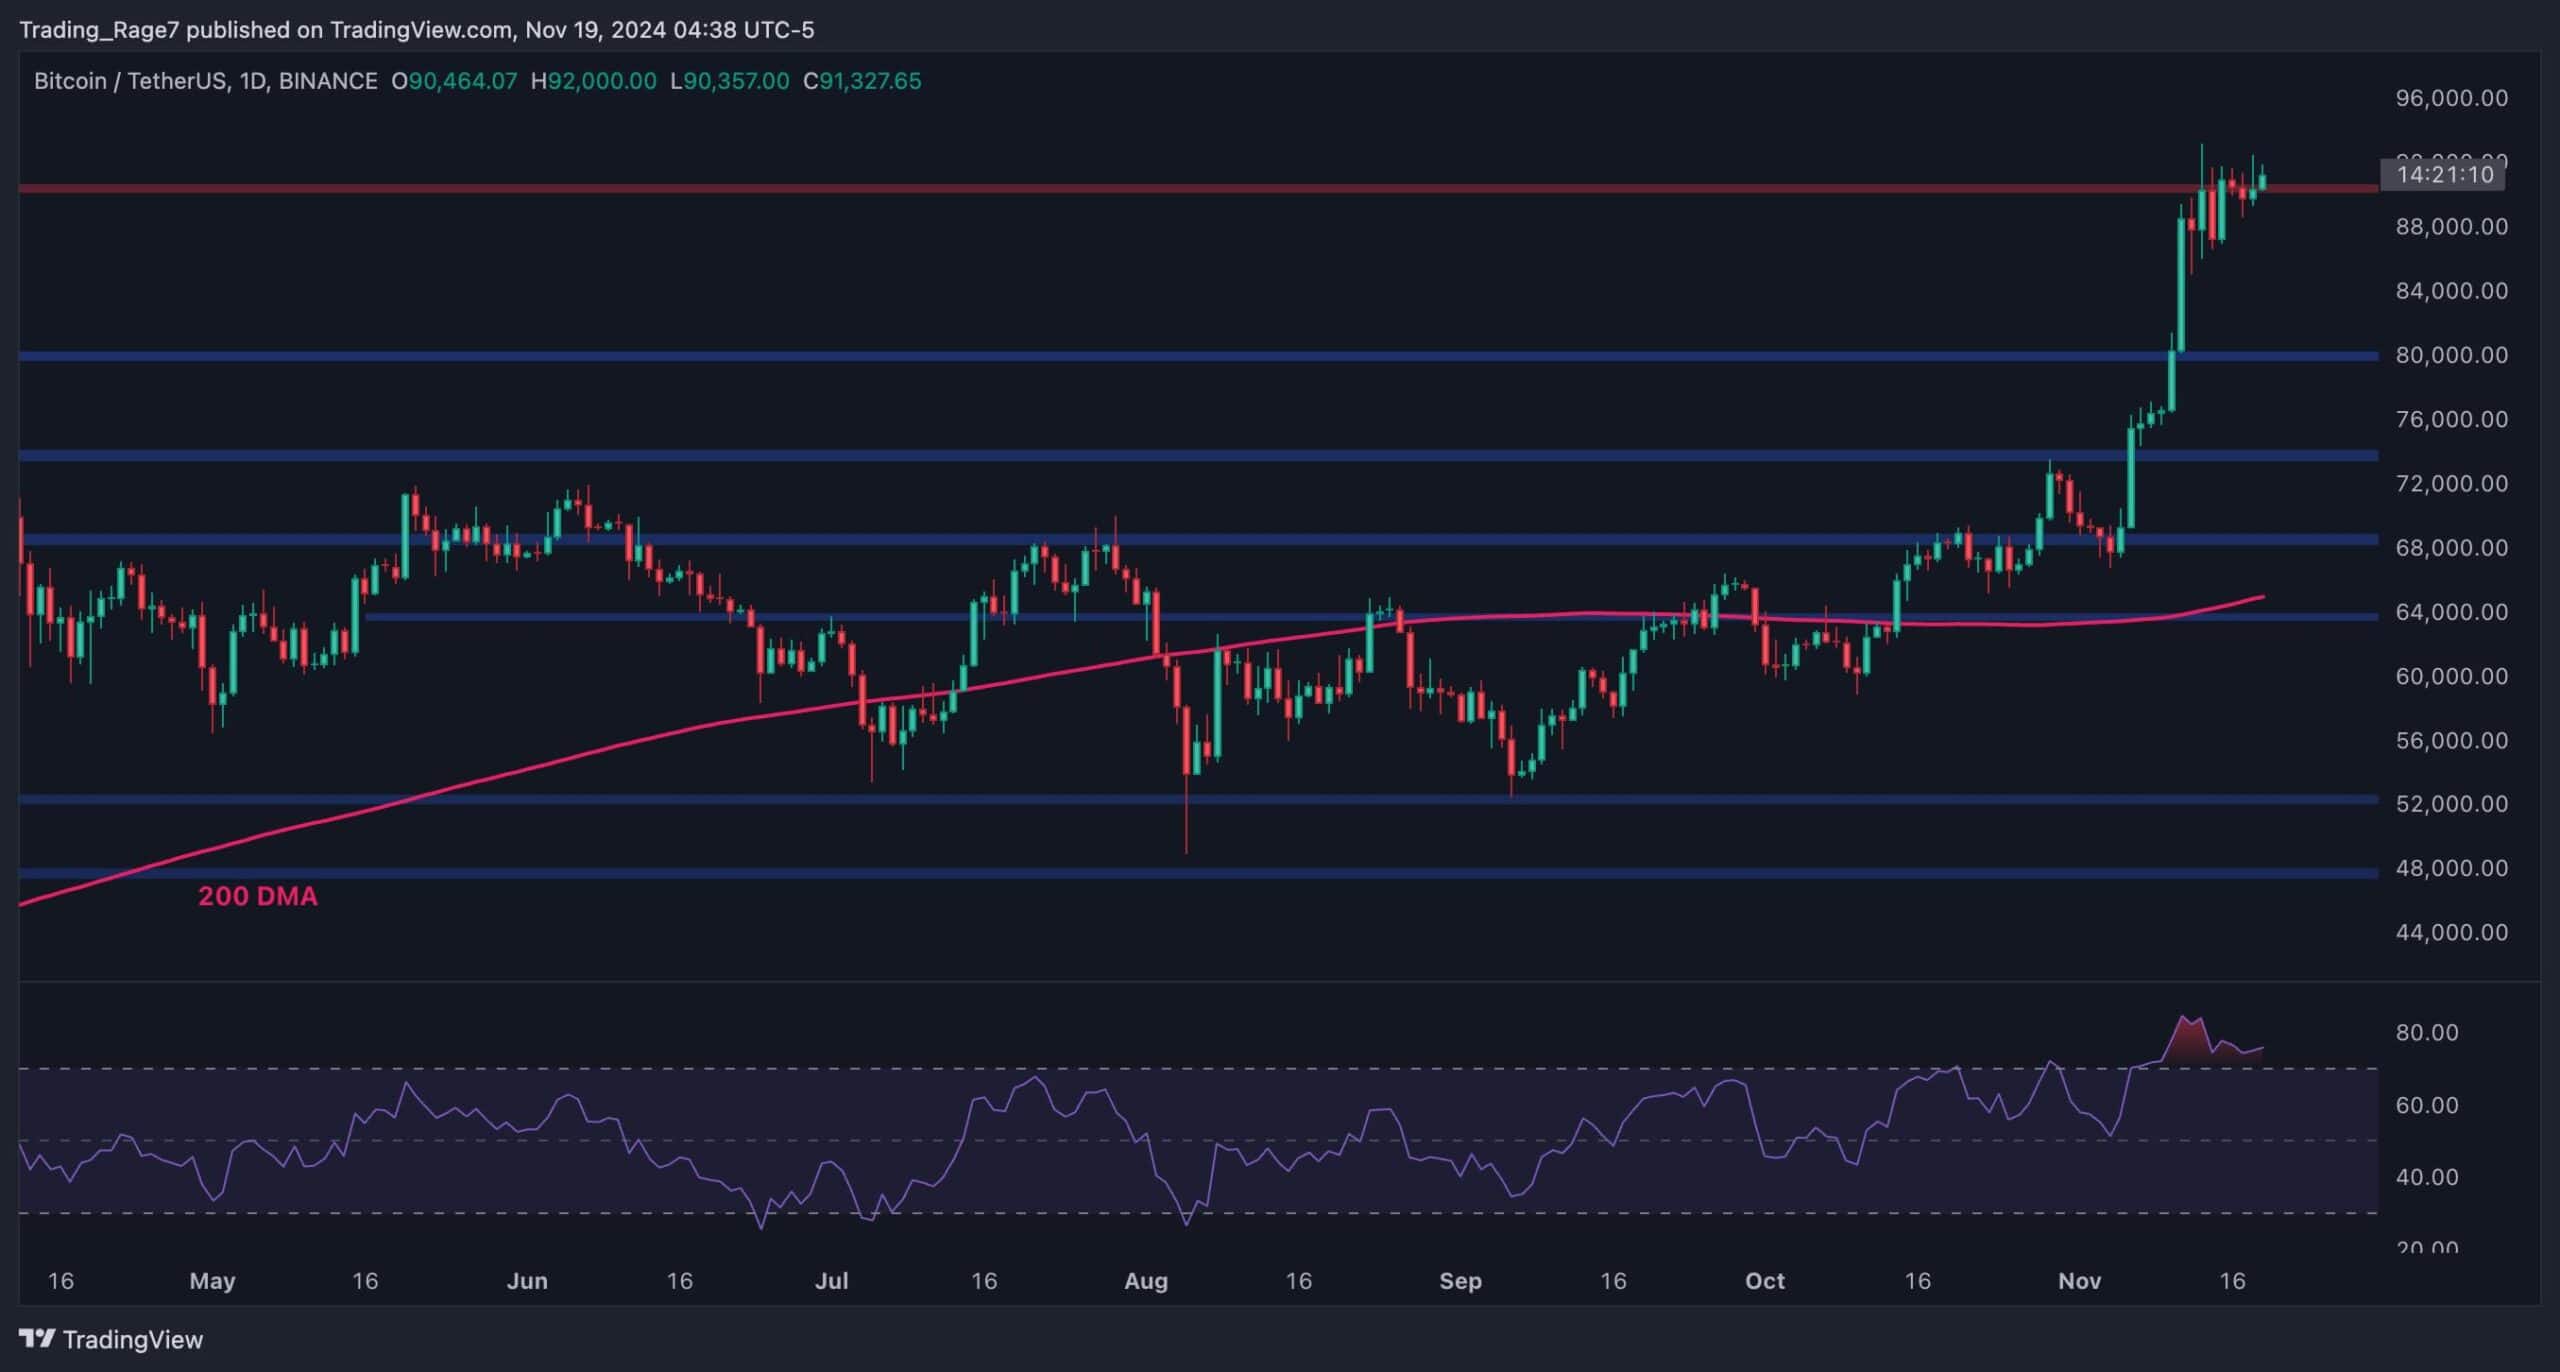
The 4-Hour Chart
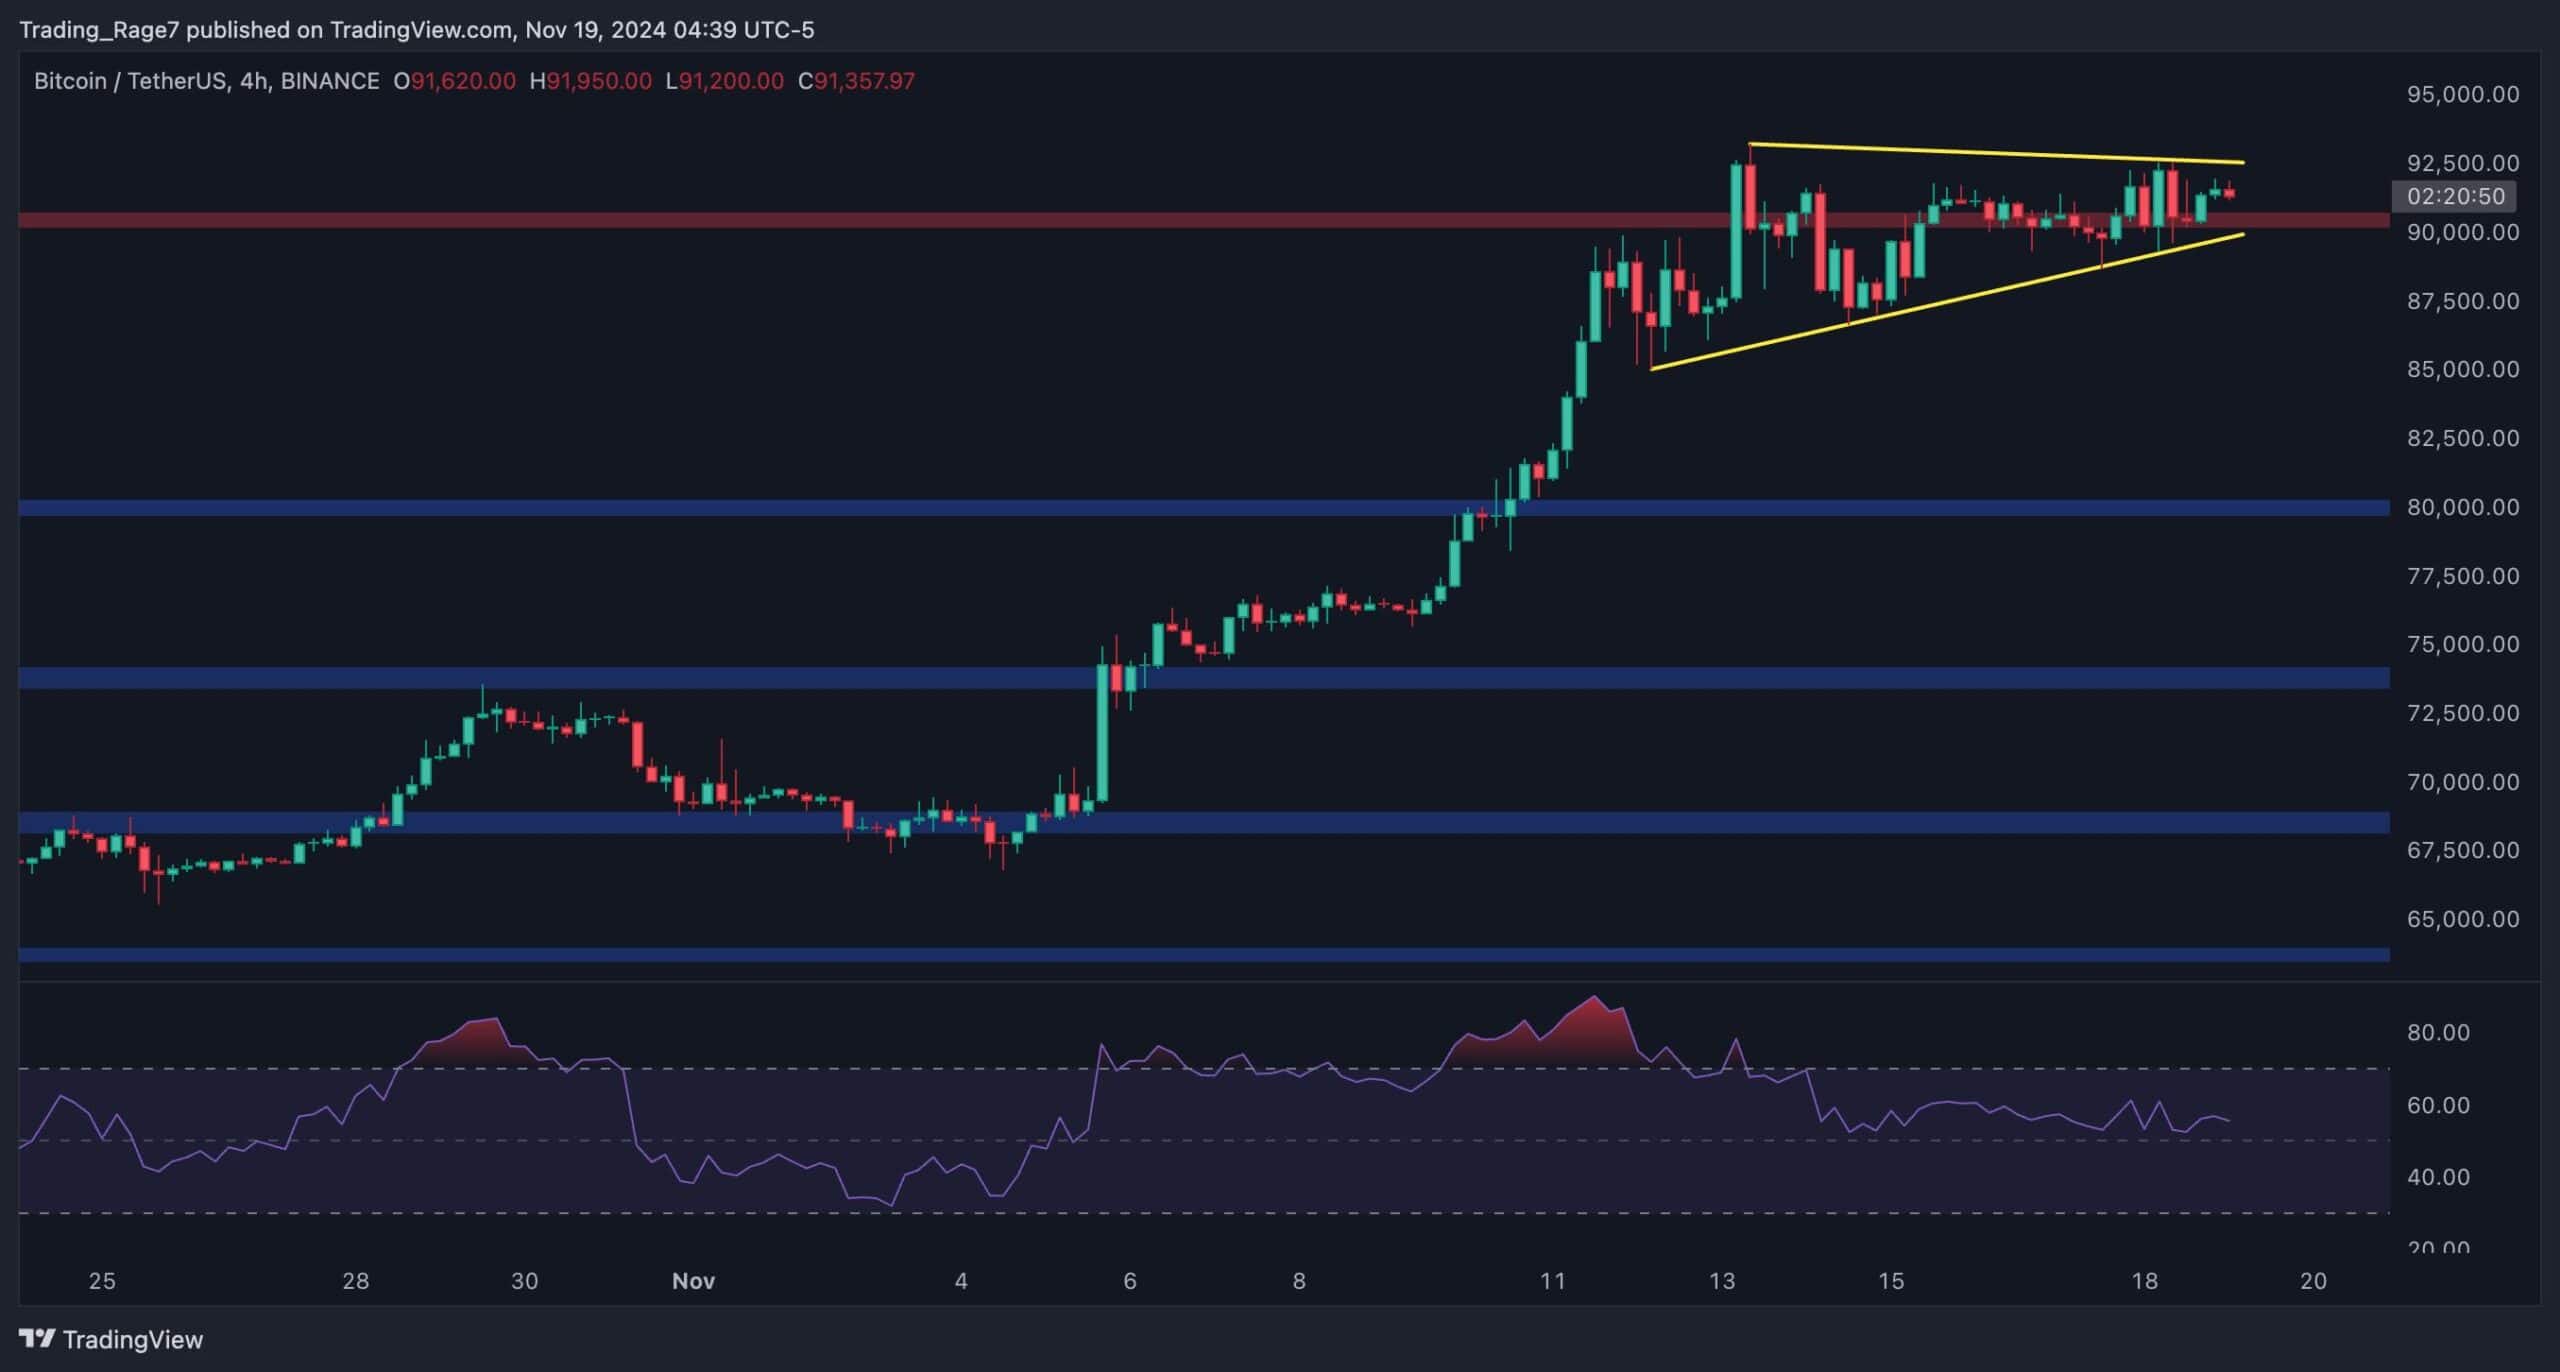
The 4-hour chart depicts a clear picture of the recent price consolidation, as the market has been forming a symmetrical triangle pattern around the $90K region.
These patterns can be continuation or reversal patterns, depending on the direction of the breakout. Yet, even if the asset breaks the pattern to the downside, it would likely be a short-term correction, as the overall trend remains bullish as long as the $80K support level is intact.
On-Chain Analysis
By Edris Derakhshi (TradingRage)
Short-Term Holder SOPR (EMA 30)
As always, technical analysis on its own might not be sufficient to understand the market dynamics of Bitcoin. Therefore, it’s beneficial to utilize the transparency provided by the Bitcoin blockchain to have a better picture of investors’ behavior.
This chart presents the Bitcoin Short-Term Holder SOPR, which measures the ratio of profits realized by holders who have bought their BTC in the last 155 days.
As the chart suggests, the 30-day exponential moving average of the STH-SOPR has been rapidly rising again, but it has yet to reach the values previously seen when BTC was trading around $70K earlier this year.
This could indicate that short-term market participants are realizing their profits less aggressively. As a result of this decrease in selling pressure compared to before, Bitcoin is likely to rally much higher in the near term.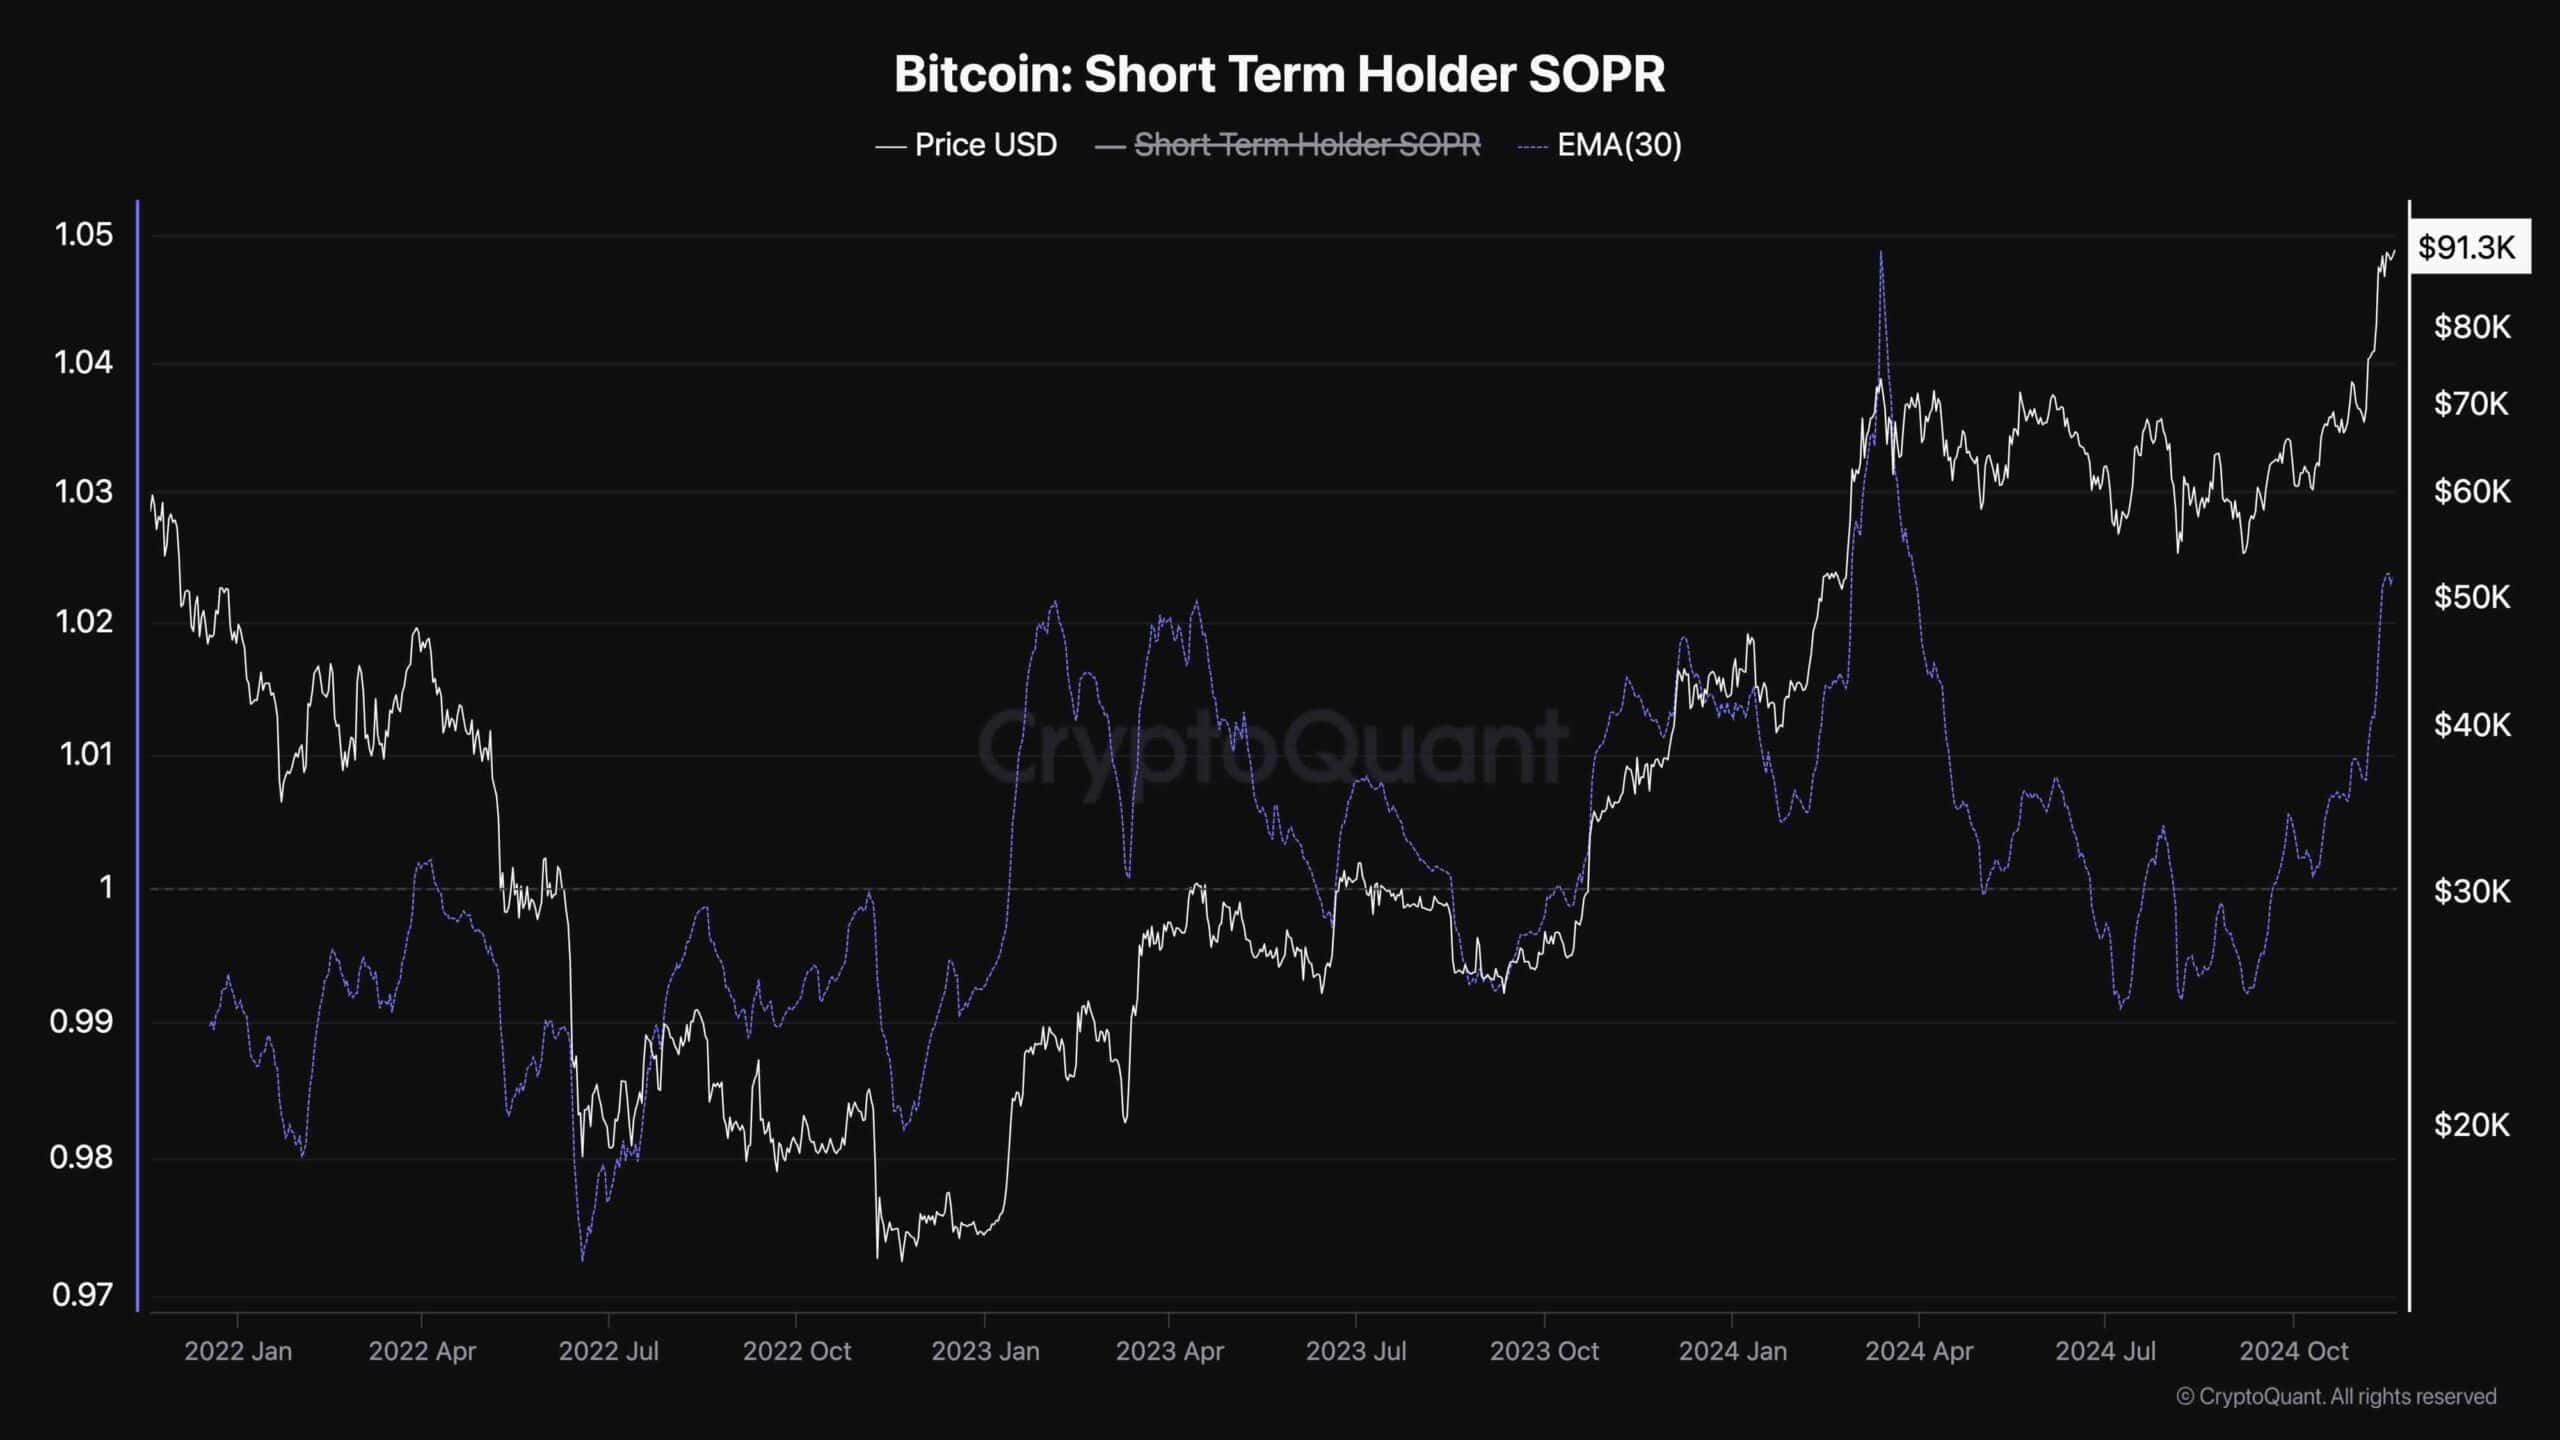
The post Bitcoin Price Analysis: Consolidation Nears its End as BTC Prepares for New All-Time High appeared first on CryptoPotato.


