Bitcoin Price Analysis: Can BTC Surpass $20K Soon Despite The CME Gap?
Bitcoin price is recovering from yet another heavy sell-off this week after prices fell $1,600 on December 1 to a low of $18,100.
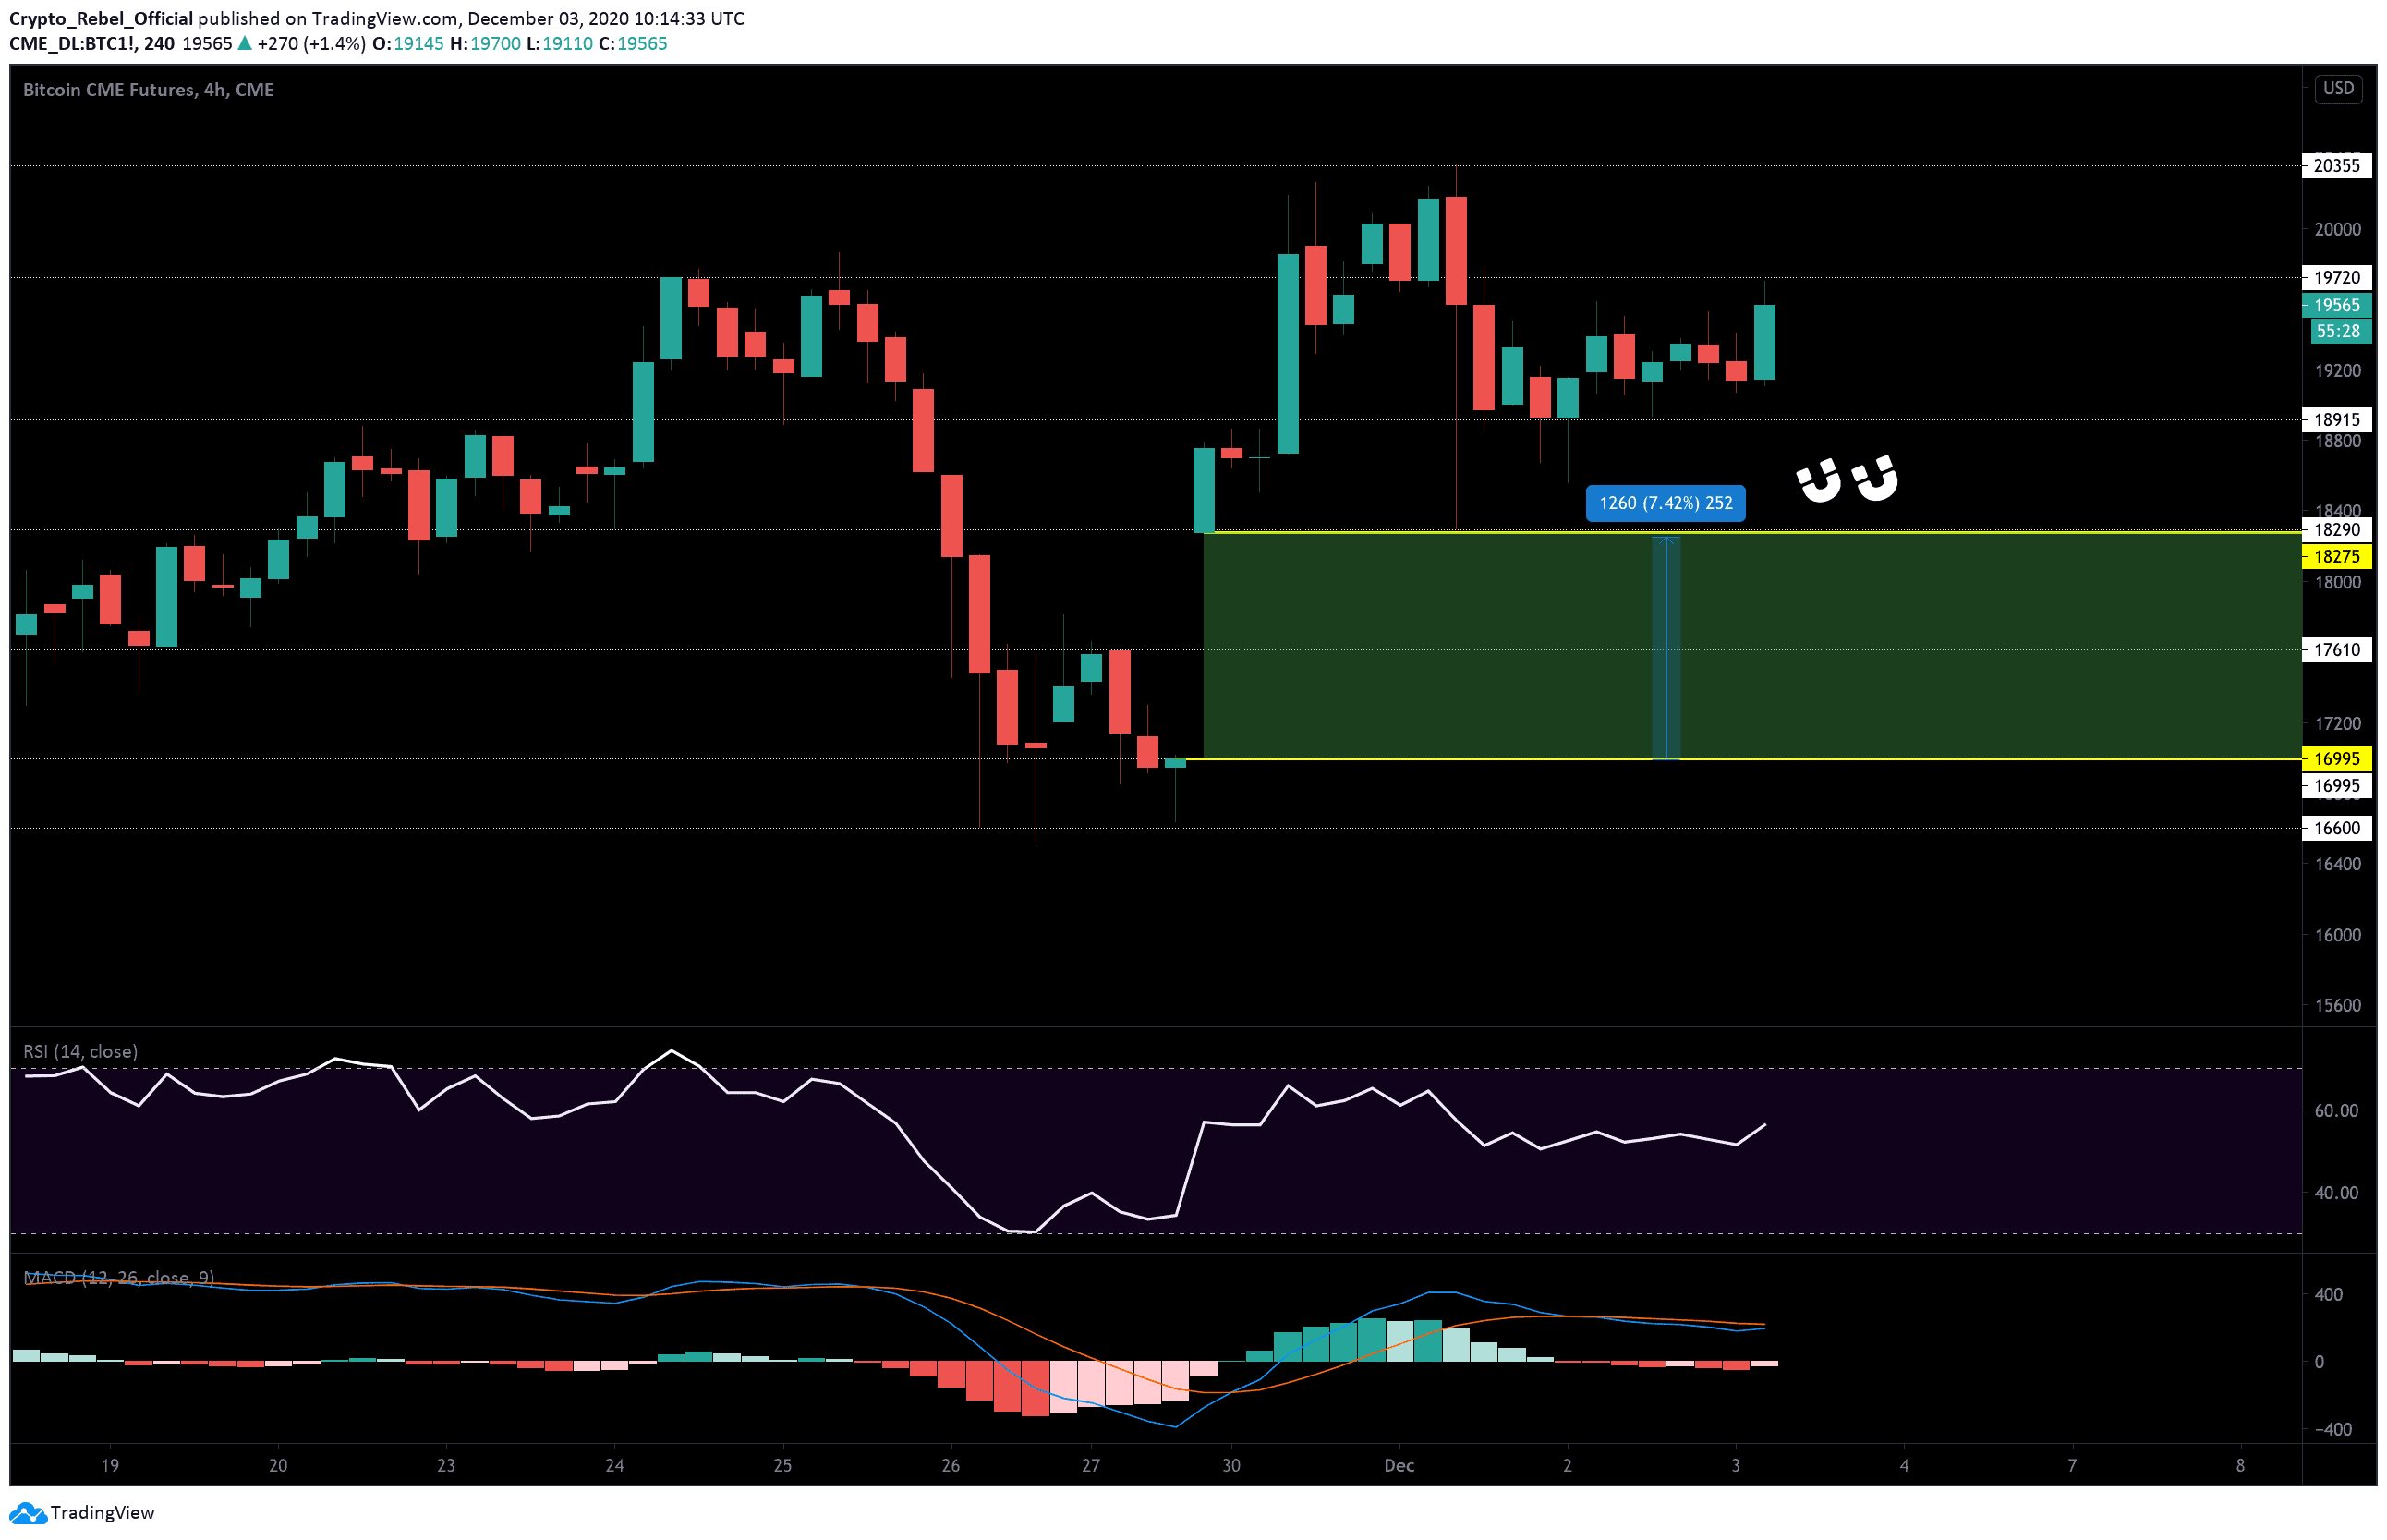
Despite fears of BTC closing the substantial CME gap below between $18,275- $16,995 (see chart), bullish traders have managed to successfully drive prices back above the psychological $19,000 mark.
If they can retrace back to the current high at $19,707, it will be the 3rd time bitcoin buyers have fully recovered from a $1,000+ crash in the last 12 days and will demonstrate that overall market sentiment is still favourably bullish.
The global crypto market has grown by $8 billion in the last 24 hours. However, trading volume has fallen by $80 billion. This seems to suggest that more traders are choosing to HODL right now instead of trading the dip.
Price Levels to Watch in the Short-term
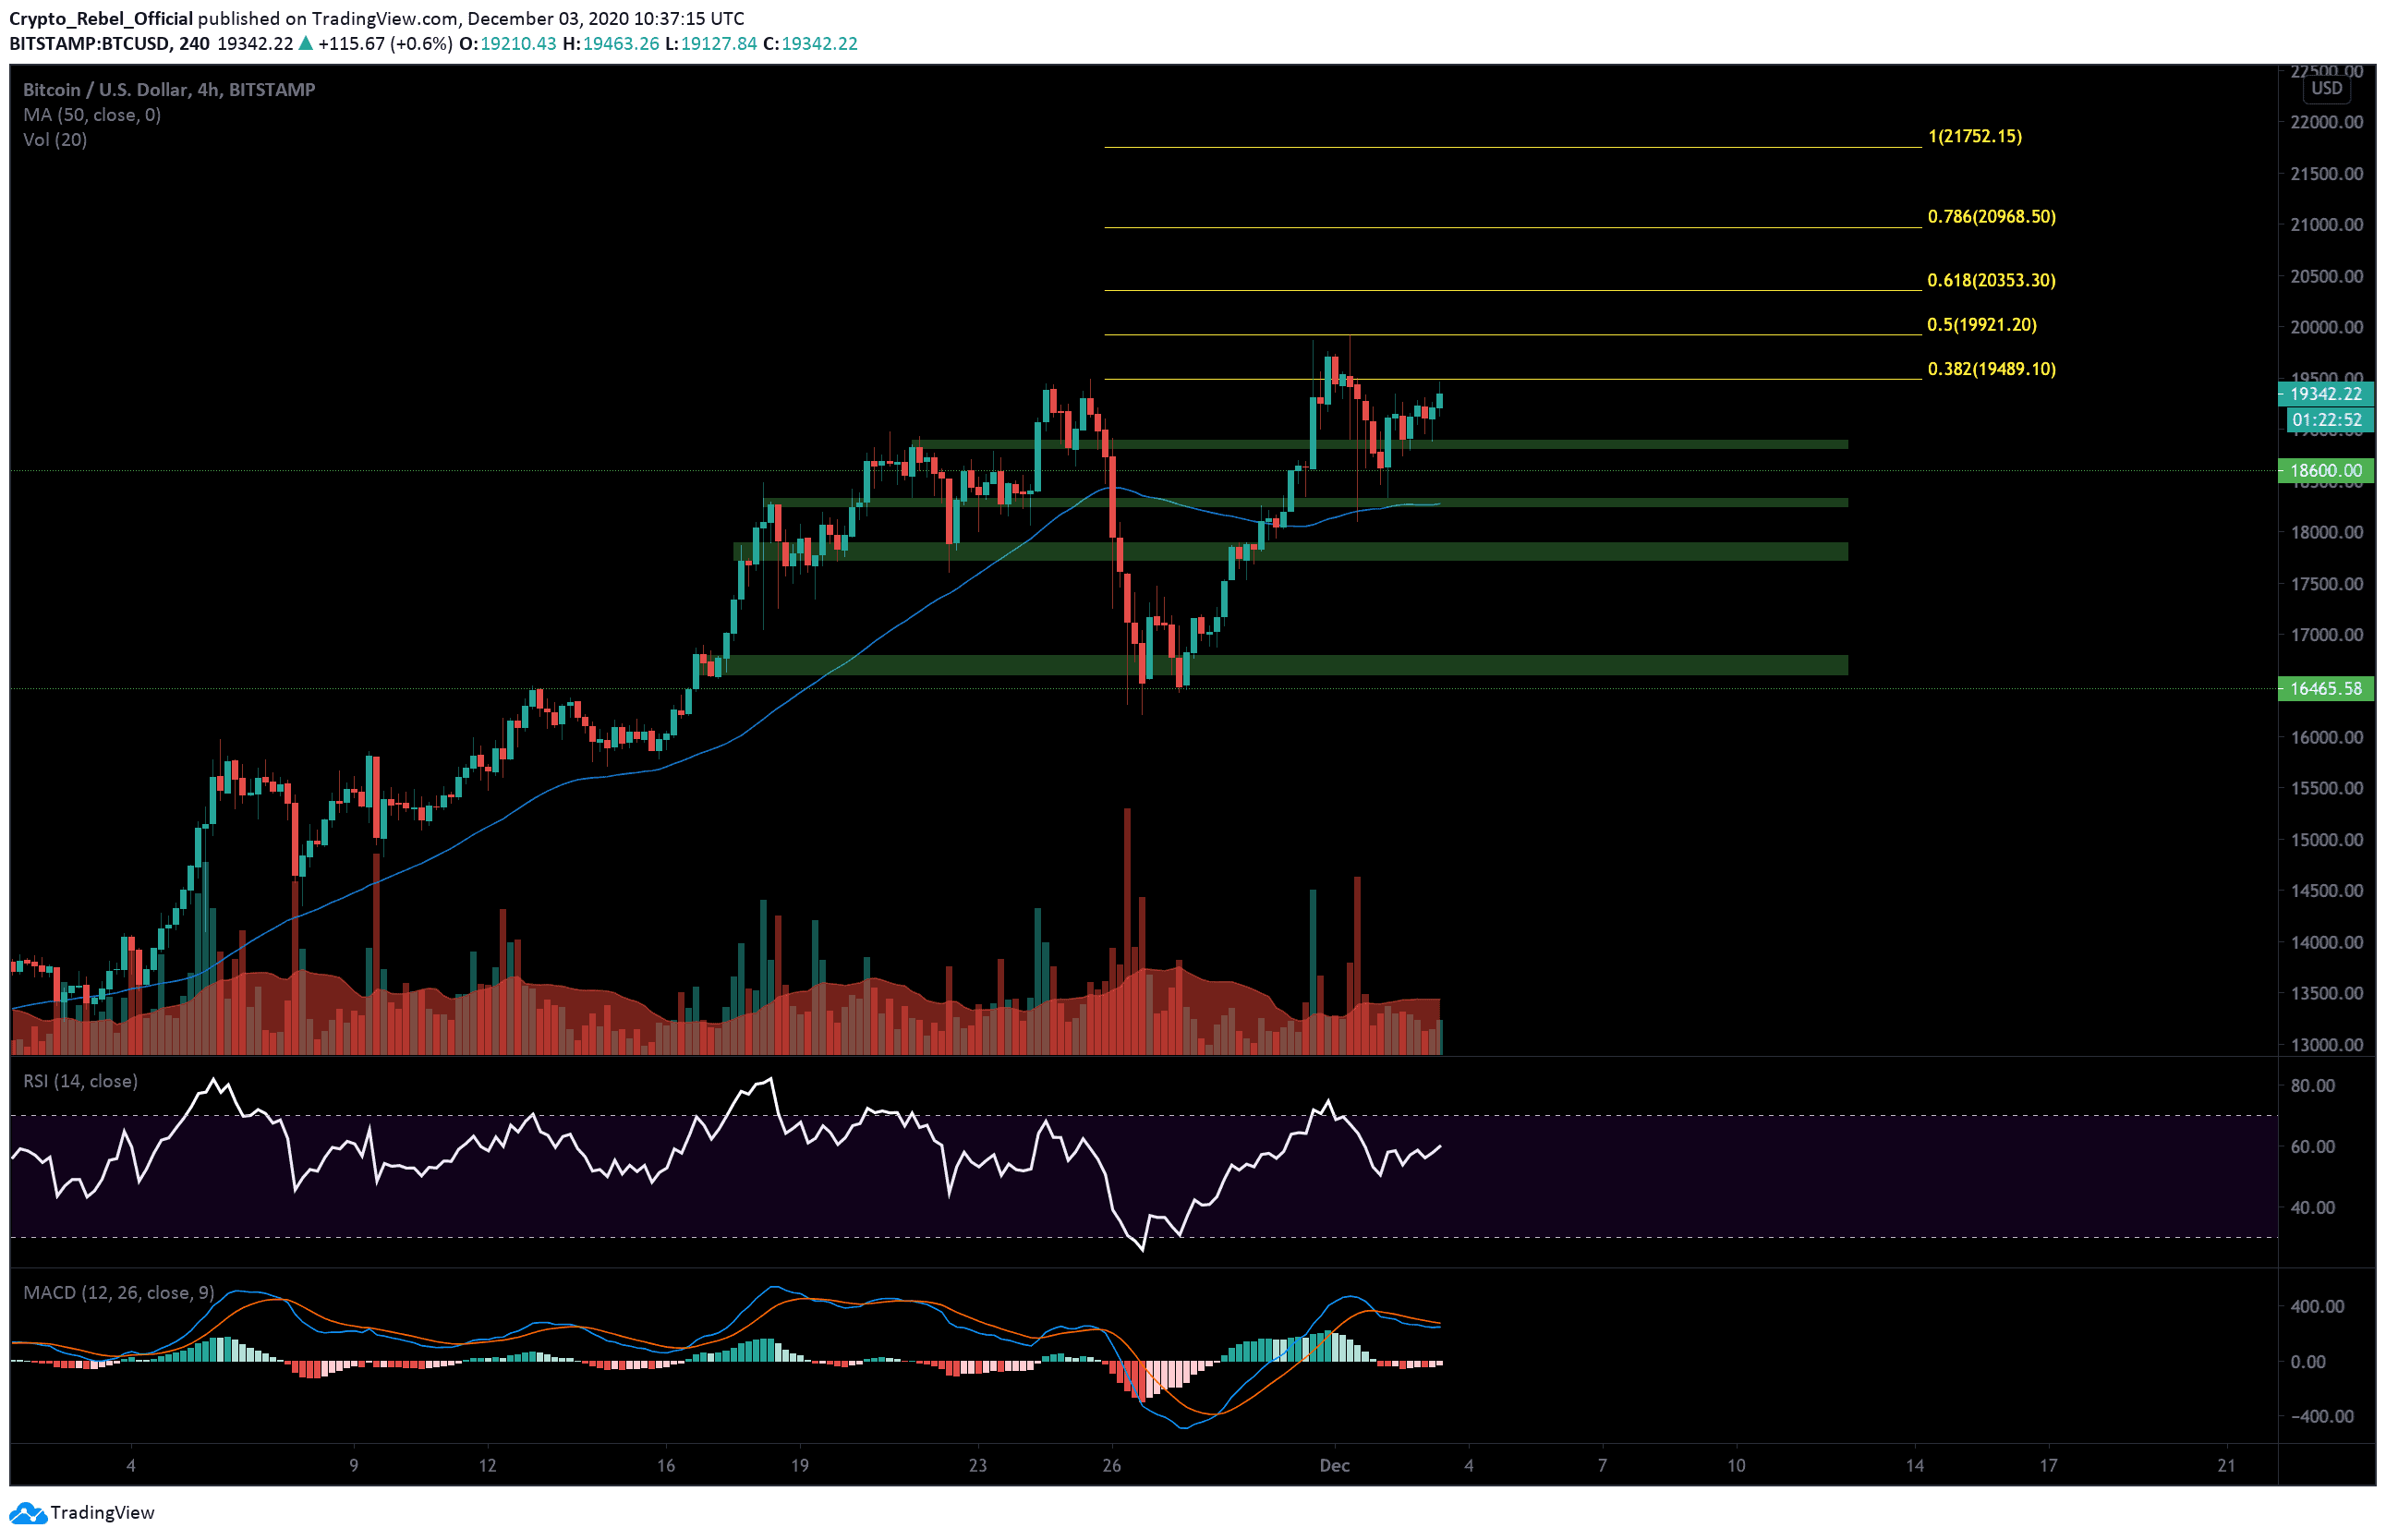
On the 4-hour BTC/USD chart, we can see that the $18,600 S/R level (green dashed line) acted as key support during the crash yesterday and allowed bulls to relaunch back over $19K quickly.
The new uptrend is being inhibited by the 0.382 Fibonacci extension level (lowest yellow line) at $19,489 that was also the former high during the top of the November 25th rally. A close above this would put BTC in a good position to challenge the current close high at $19,700 and the next Fibonacci extension level at $19,921 (0.5).
Above that, we have additional extension levels at $20,353 (0.618), the 0.786 level at $20,968 and and the 1.0 level at $21,752.
If bullish traders fail to overcome this critical level, then the first major support zone at $18,880 (green bar) will likely see a reaction if bears break the $19K level. Beneath that, we have the aforementioned $18,600 level, the second major support zone around $18,270, which also overlaps with the 50-EMA (blue line), and the third major support zone around $17,800.
Should prices break into this zone, then it will be highly likely that we’ll see the CME gap close, which could push prices down to the order block support zone between $16,800 – $16,600 (lowest green bar).
Total market capital: $586 billion
Bitcoin market capital: $360 billion
Bitcoin dominance: 61.4%
*Data by Coingecko.
Bitstamp BTC/USD 4-Hour Chart

CME BTC1! 4-Hour Chart


