Bitcoin Price Analysis: Can BTC Get Back on Bullish Track Despite Daily Close Below Important Support?
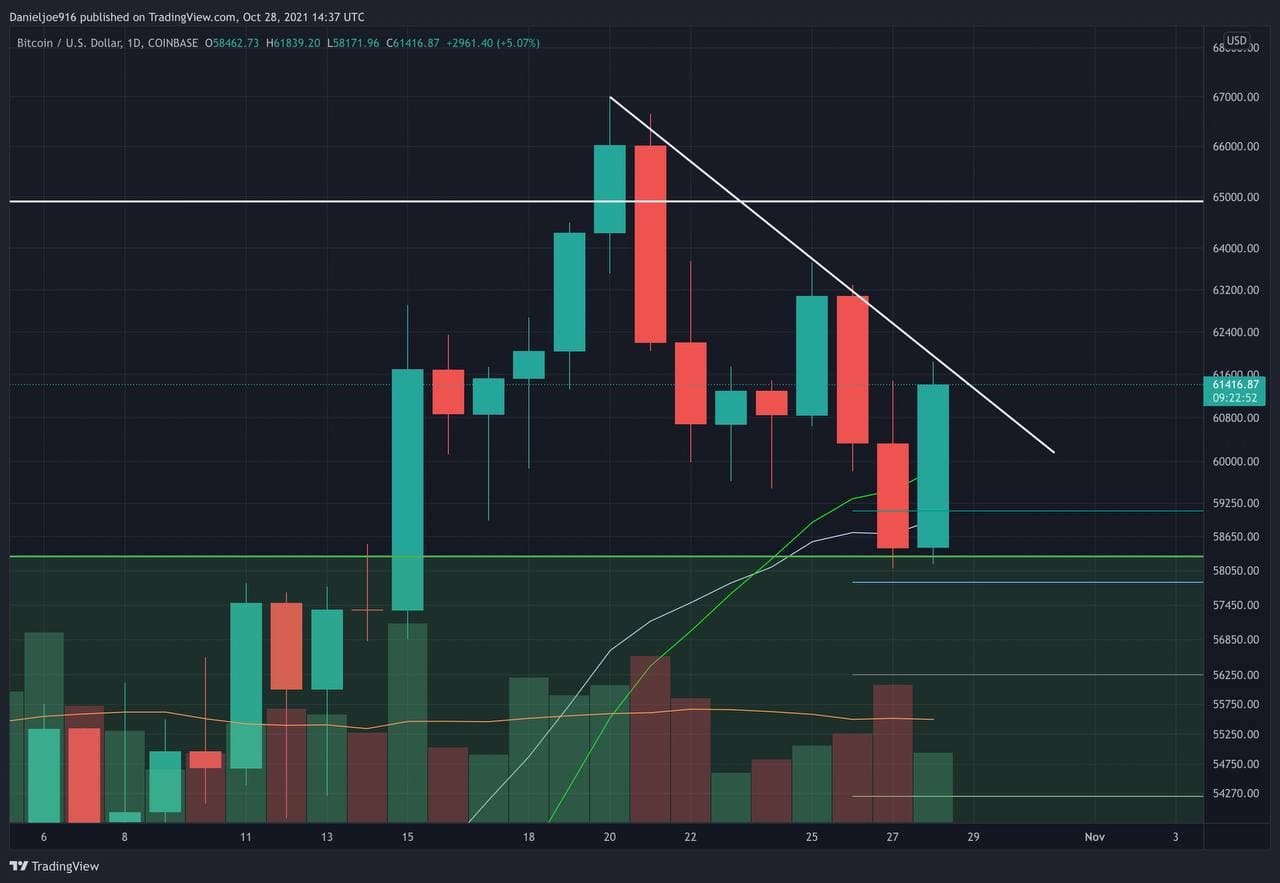
Bitcoin’s price made a daily close below $60K, the 21-day, and the 21-day EMA, which is a cautious signal in the near term. There’s a snap-back scenario in the cards where BTC closes back above these levels, but we need to wait for a daily close above them for validation.
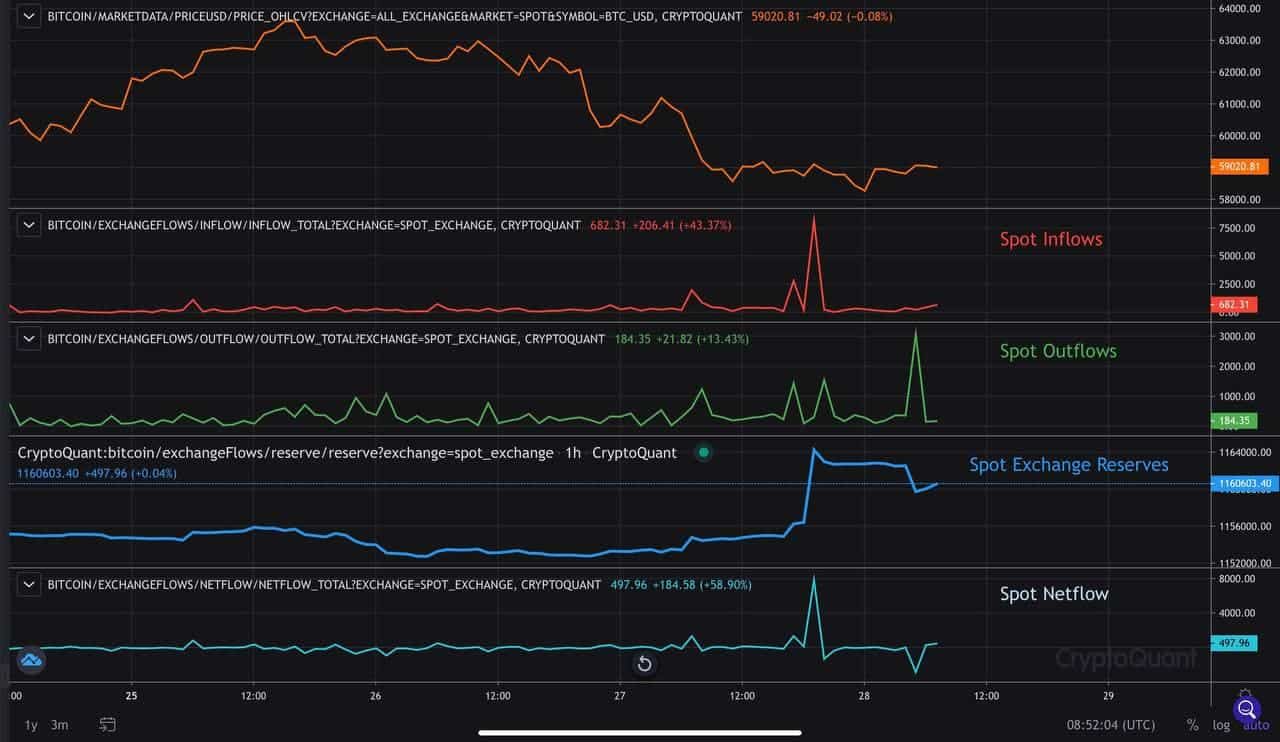
There was a large number of inflows yesterday, causing spot reserves to jump by 9435 BTC. Gemini saw particularly big inflows. Right now, bitcoin’s price is above $60K.
Technical Outlook
Overall, the trend remains bullish, despite the short-term weakness. BTC rallied 64% in a month with elevated open interest, and the leverage ratio is also close to peaking. The current shakeout can be considered a bullish signal because it helps to flush out the leverage longs and prepare BTC for the next major move higher.
This makes the overall market more sustainable, as overextended rallies tend to lead to larger drawdowns. It’s still too early to confirm a technical bottom at $58.1K as BTC remains below a key downtrend line at $62K and needs to make a higher high above $63.7K for confirmation.
There’s strong support remaining between $58.3K to $53K in terms of a technical and on-chain perspective.
On-Chain Analysis
Although spot reserves increased by 9435 BTC yesterday, on-chain metrics continue to show no major signs of aggressive distributions from long-term holders (LTHs) or miners.
The 1-to-3-month cohort continues to take profit – mainly younger coins and traders who sold. The Mean Coin Age made another all-time high. Older cohorts, on the other hand, continue holding. The ASOPR fell back towards 1, which indicates that the overall market is breakeven. This has historically been a support level for BTC throughout bull markets. During September, the ASOPR fell below 1 for a while throughout the liquidation event and then pushed back above it.

Miners continue to build reserves, and they show no signs of aggressive distribution.
In Conclusion
The current pullback in the BTC price is healthy for the market structure and makes the bull run more sustainable. Stocks continue to push higher, which gives even more merit to the resuming of the risk-on trade, especially as the dollar remains in a downtrend. Money’s flowing out of long-term bonds and rotates into risk assets.
In the short term, there’s still a risk of a flush-out as the leverage remains elevated at .18. However, it’s good to see it trend lower for the past day.
Overall, the trend remains bullish as LTHs and miners continue holding their BTC.


