Bitcoin Price Analysis: Can BTC Bounce Back to $100K Following 8% Weekly Drop?
Bitcoin has been navigating an ascending consolidation phase near its critical $108K resistance level, recently encountering a sharp decline.
However, strong support zones suggest a potential for a short-term bullish rebound.
Technical Analysis
By Shayan
The Daily Chart
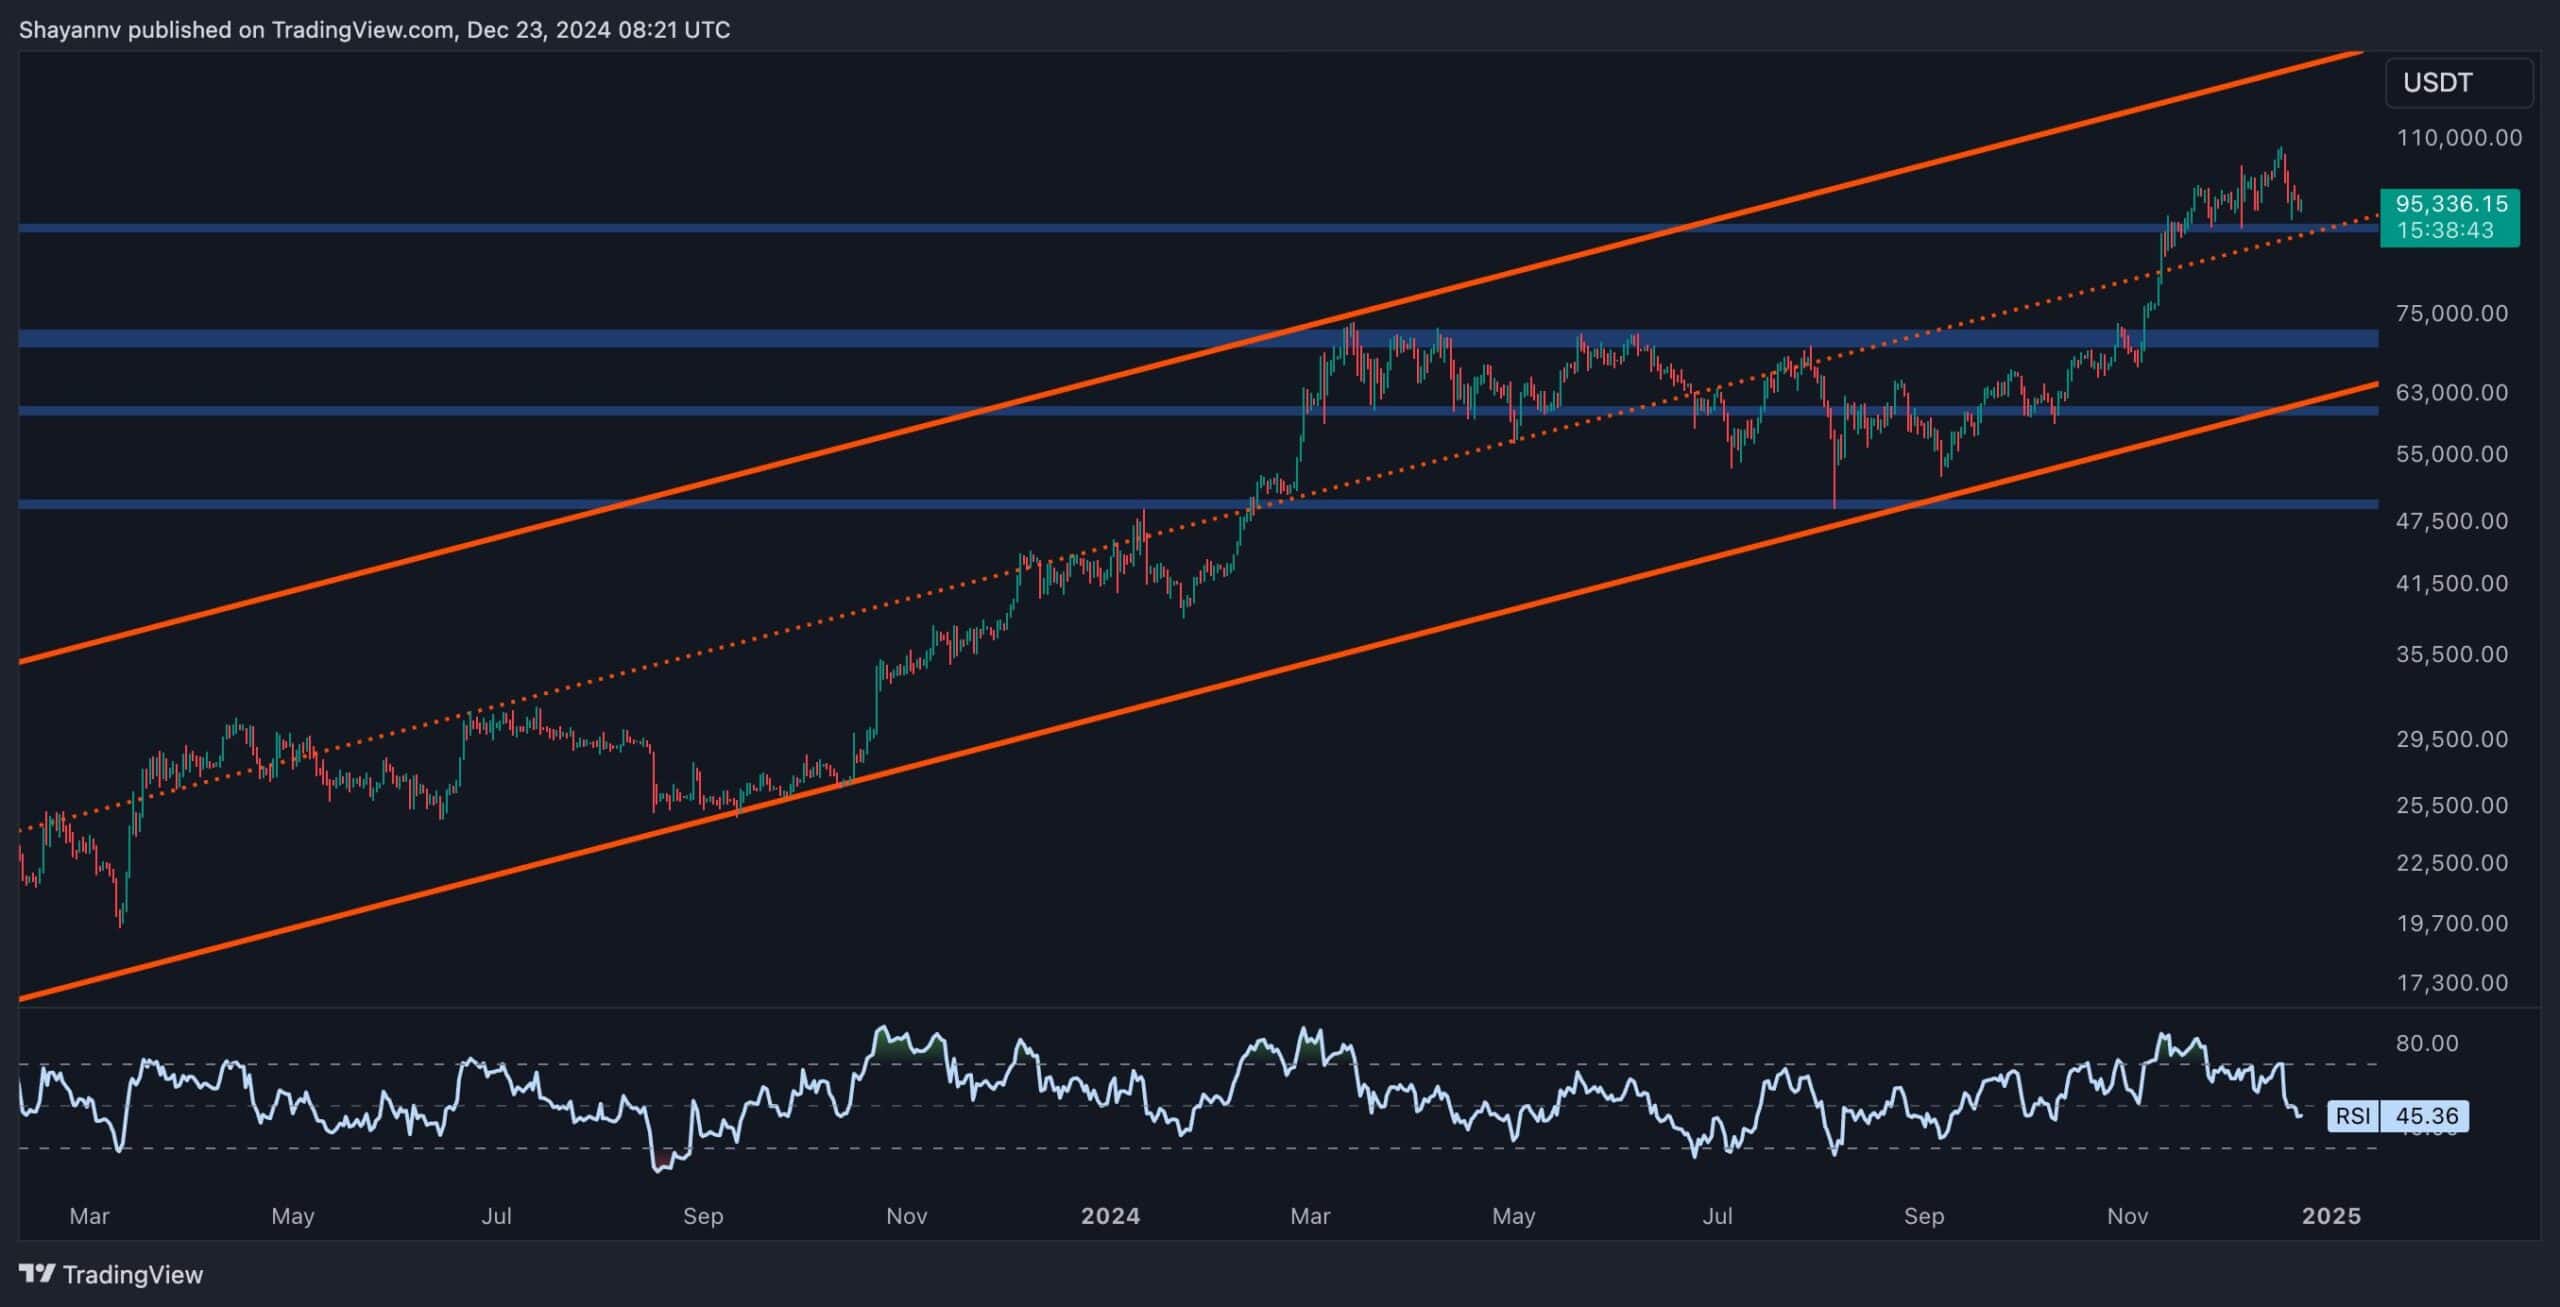
Bitcoin has undergone an ascending consolidation phase near the $108K resistance region, only to face increased selling pressure and distribution activity from large market participants.
This wave of selling led to a significant 15% decline, with the price finding support around the $90K mark and the middle boundary of a long-standing bullish price channel. These levels represent a critical defense line against further declines.
A rebound from this support could set the stage for a renewed attempt to reclaim the $108K mark. Conversely, a failure to hold it may lead to a deeper correction, with the channel’s lower boundary near $75K serving as the next key level of support.

The 4-Hour Chart
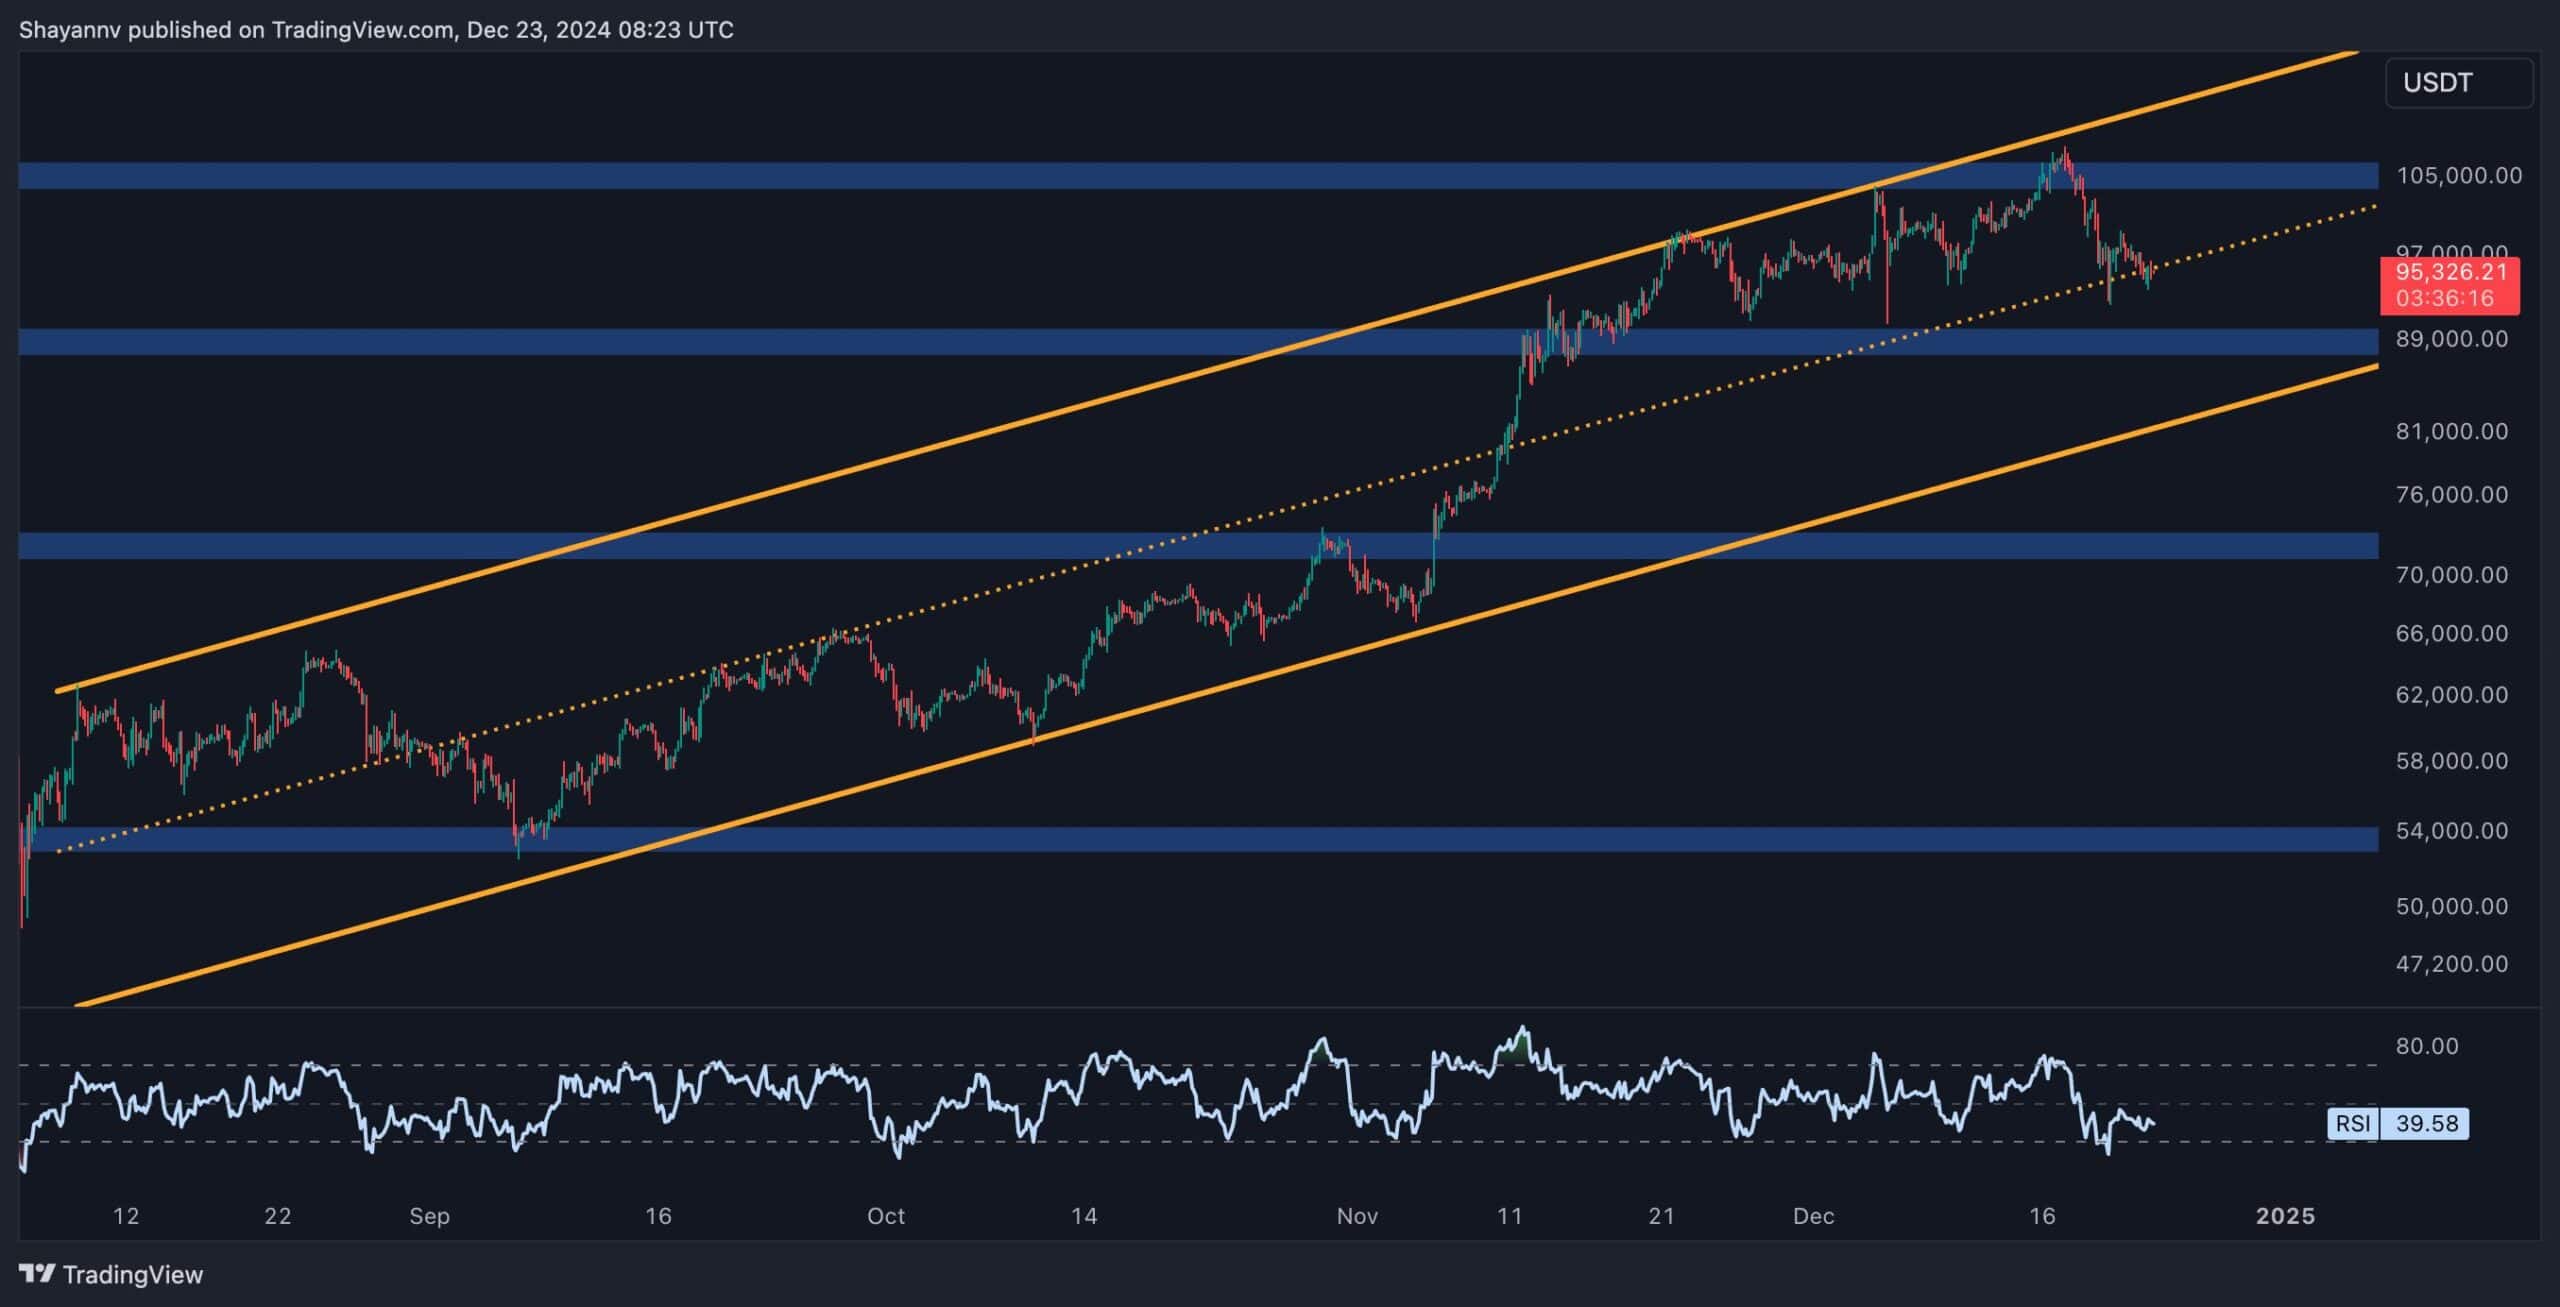
On the 4-hour chart, Bitcoin has been consistently trending upward within a multi-month bullish channel. The recent rejection at $108K triggered a sharp decline, bringing the price down to the channel’s middle boundary near $95K, a crucial dynamic support level.
A bounce from this region is anticipated, allowing the price to stabilize and potentially resume its uptrend. However, concerns over a hawkish monetary policy for 2025 may amplify selling pressure, increasing the likelihood of a bearish breakout.
In such a scenario, Bitcoin could face further downside, with $90K as an immediate target and $75K as long-term support.

On-chain Analysis
By Shayan
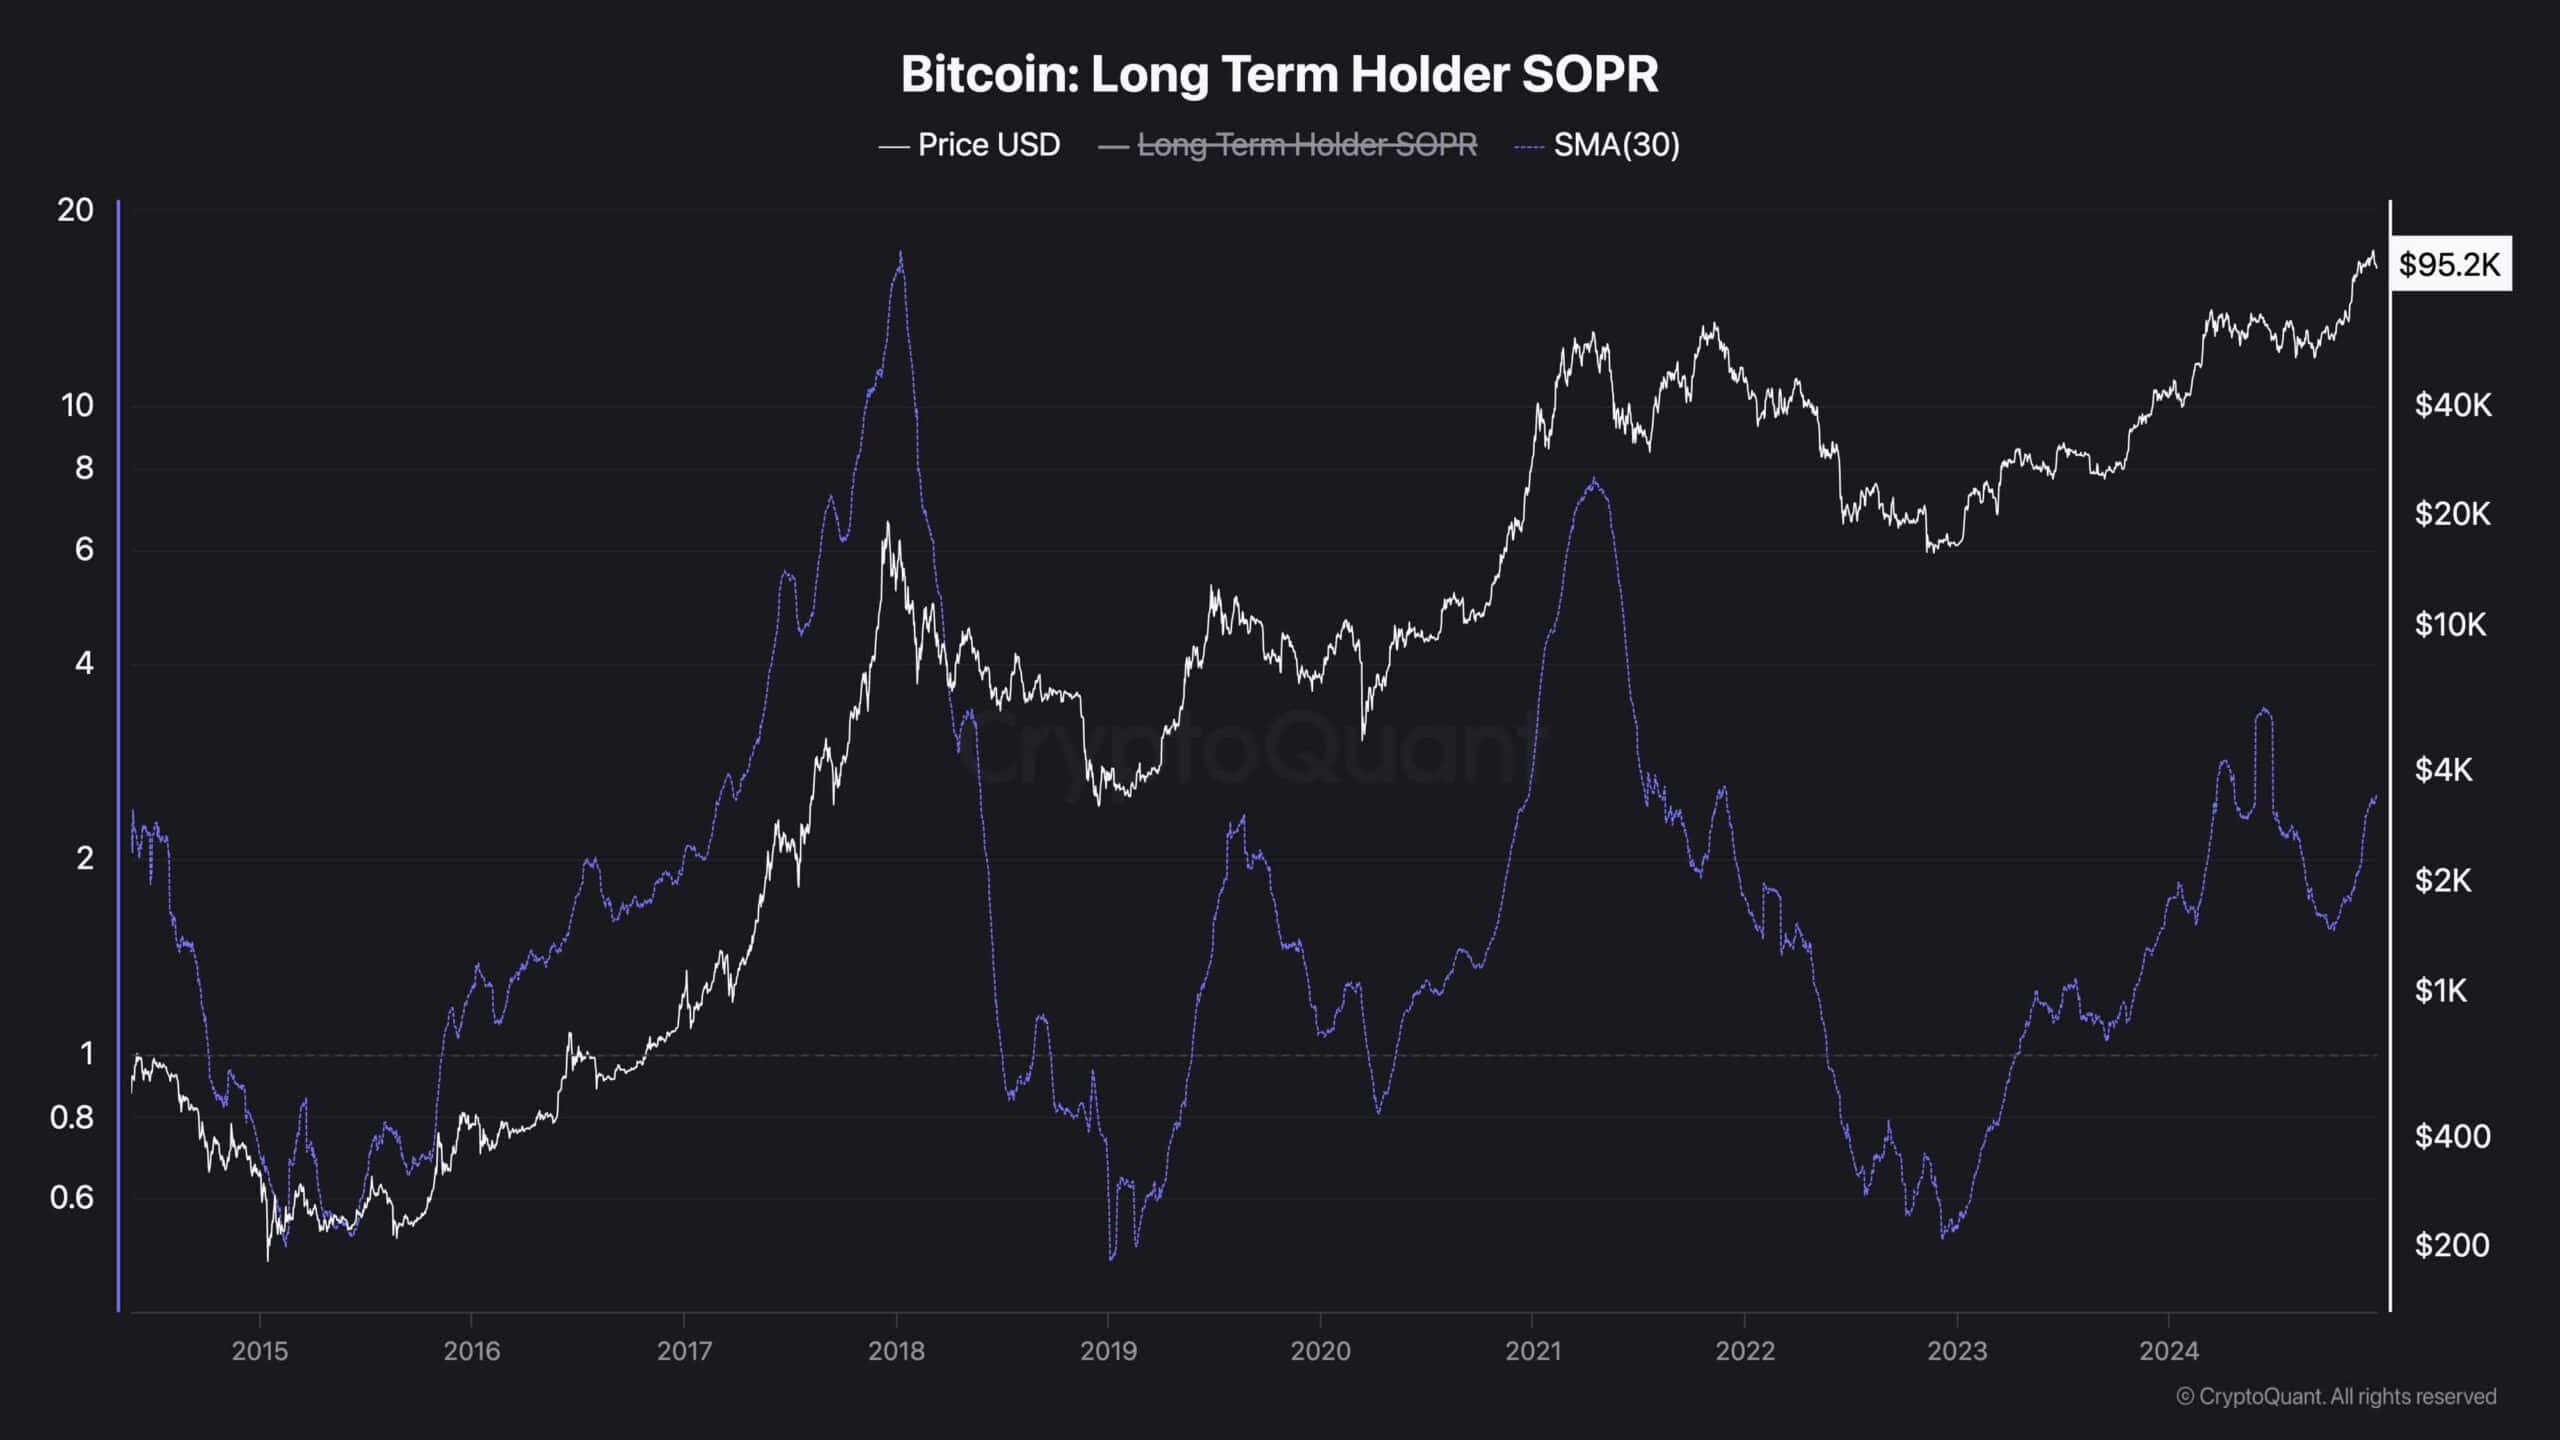
The Bitcoin Long-Term Holder SOPR metric provides valuable insights into market behavior and investor sentiment. Between 2022 and mid-2023, the SOPR remained below 1 for an extended period, indicating that long-term holders were selling at a loss associated with market capitulation.
By mid-2023, the SOPR began trending closer to or above 1, marking the beginning of a recovery. This shift was aligned with a broader market rebound as Bitcoin prices rose, reflecting renewed confidence among investors. The upward trend in SOPR suggested that long-term holders were no longer selling at a loss, a key sign of improving sentiment.
As the market moved into 2024, Bitcoin prices continued to climb, and the SOPR consistently stayed above 1. This shift signified that long-term holders realized profits, but the selling pressure remained controlled.
The stability of the SOPR above 1 highlights sustained confidence among investors, reinforcing that market conditions support continued growth, with a potential for further market expansion.

The post Bitcoin Price Analysis: Can BTC Bounce Back to $100K Following 8% Weekly Drop? appeared first on CryptoPotato.


