Bitcoin Price Analysis: BTC’s Triangle Formation Is Likely To End With a Huge Move
While the crypto market is celebrating a new all-time high to the second-largest crypto, Ethereum, Bitcoin saw a minor 3% price spike over the past 24 hours as it trades slightly below $38K. On a larger scale, BTC has been trading sideways for the past 12 days after nailing its ATH level at $42,000 On January 8, 2020.
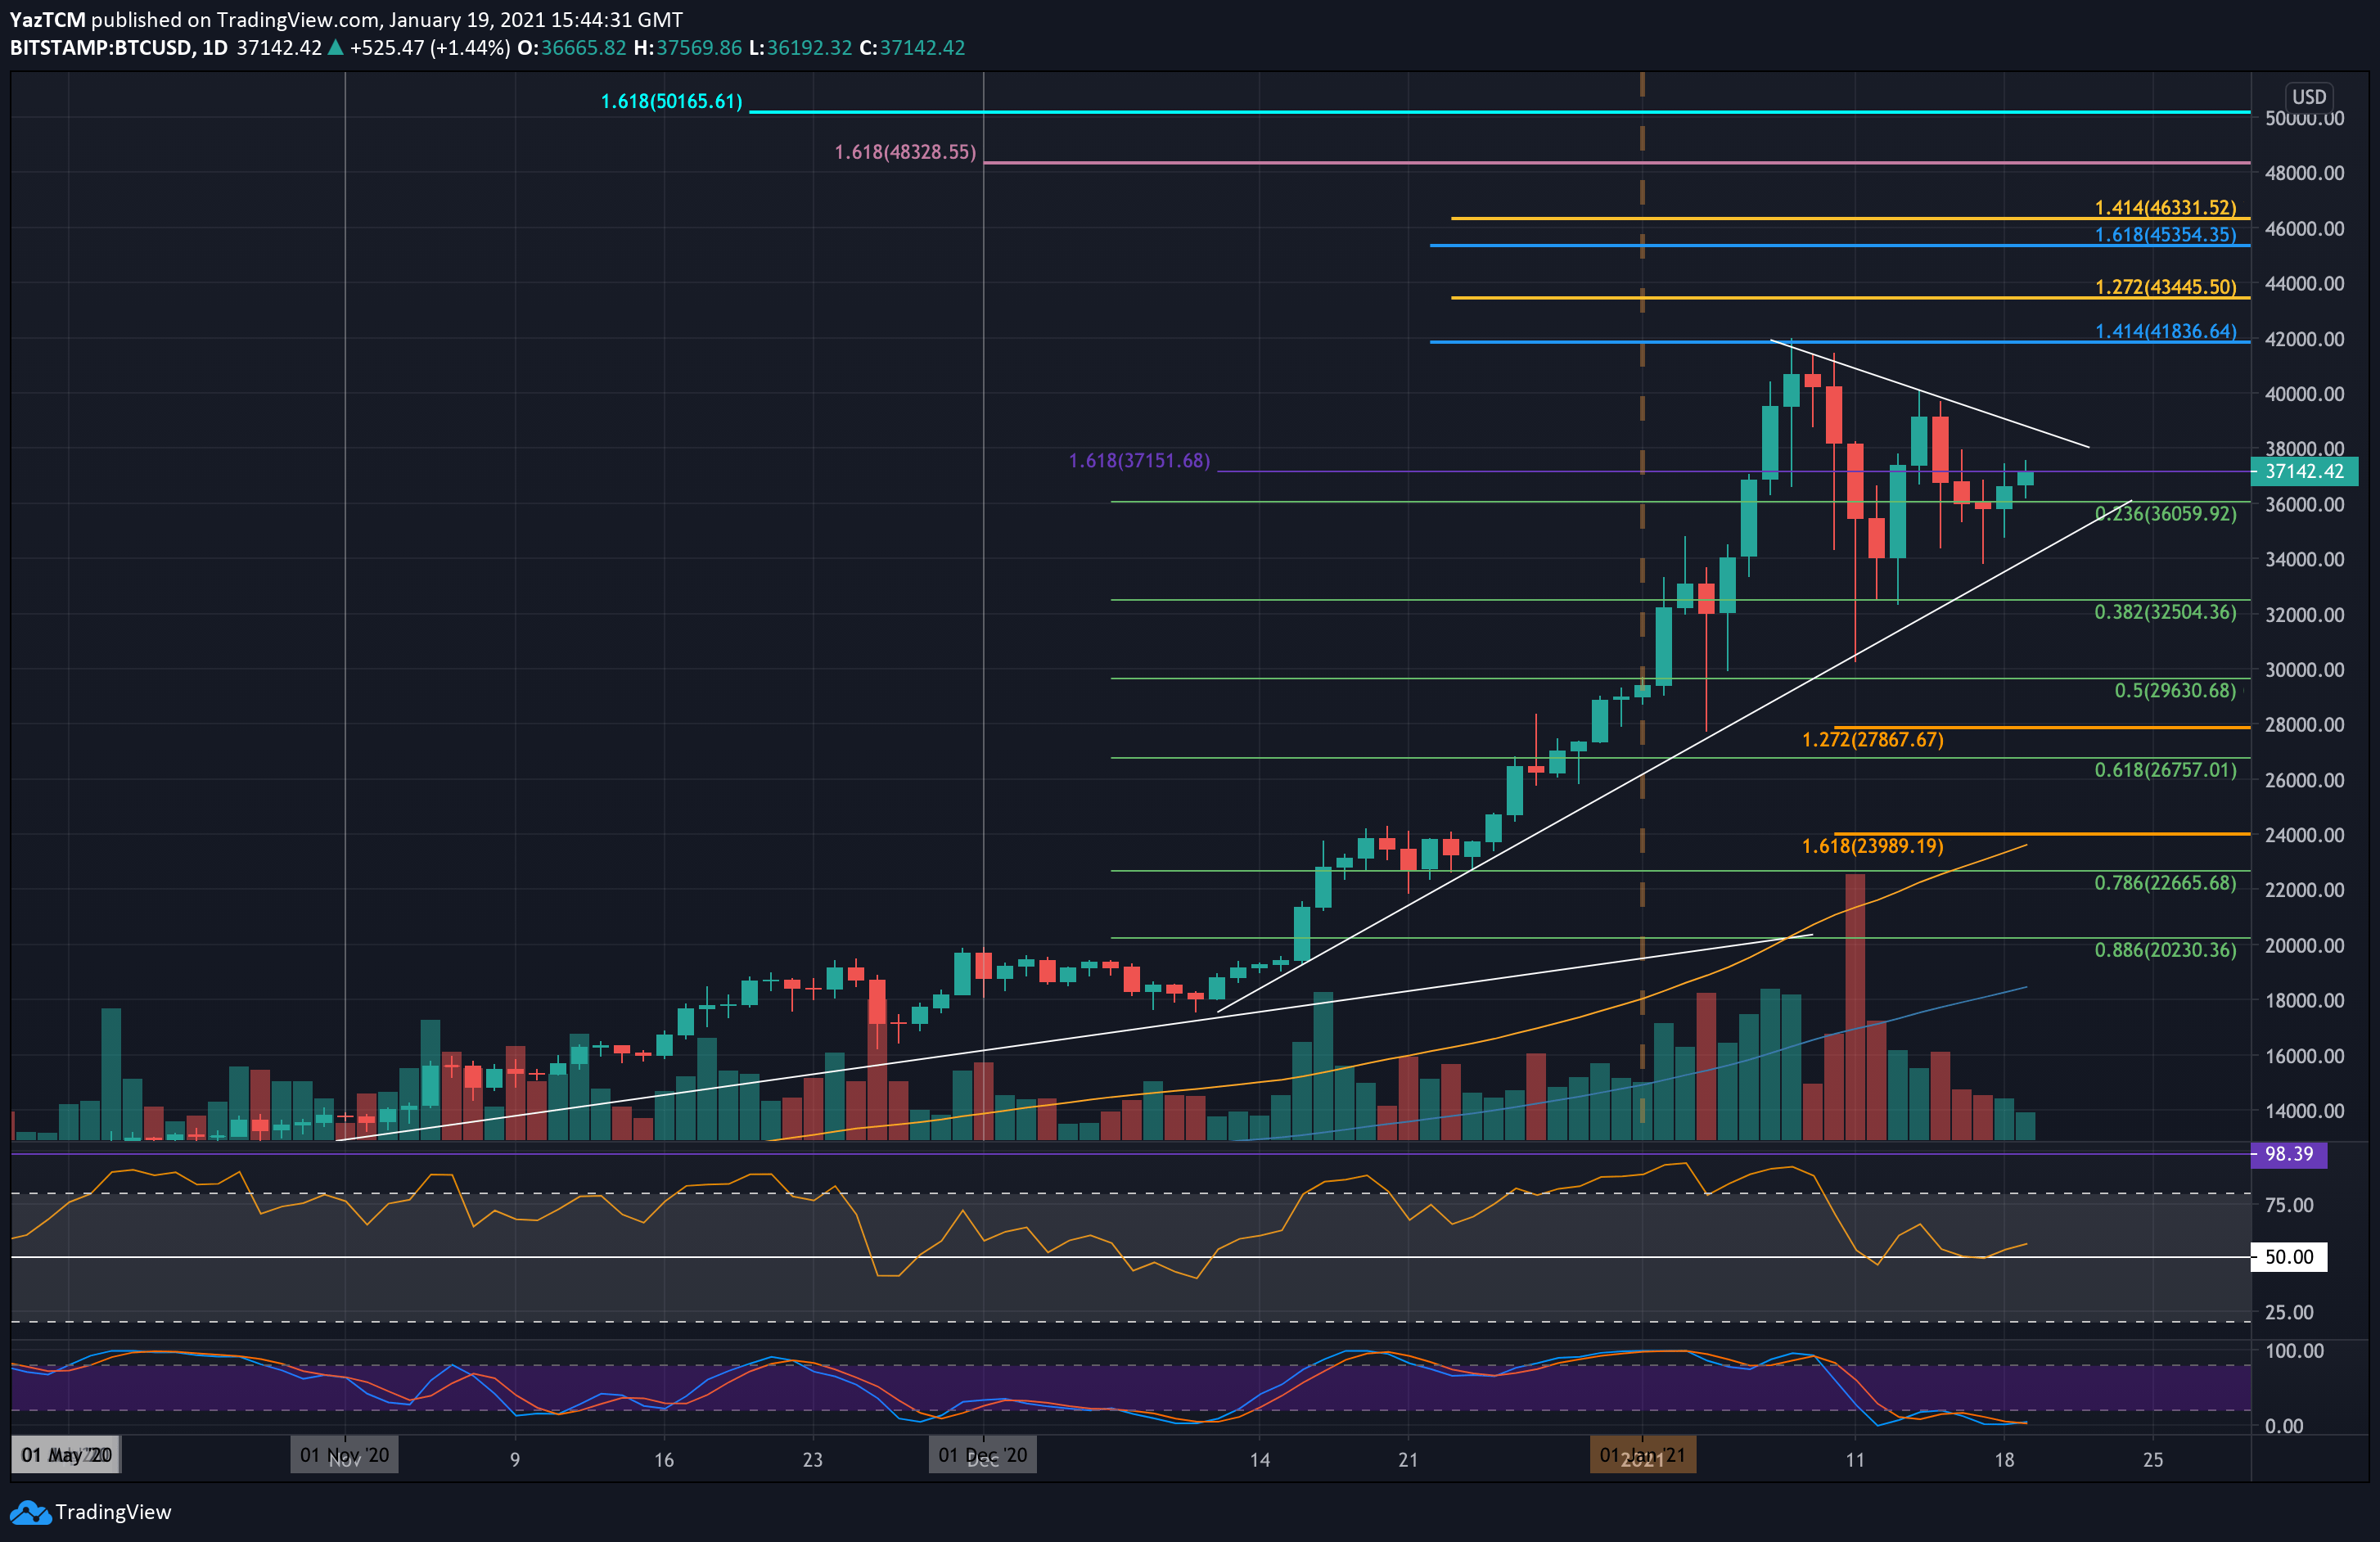
From there, Bitcoin started to consolidate as it forms a giant symmetrical triangle pattern, as can be seen on the following 4-hour chart. Over the weekend, Bitcoin fell from the resistance at $37,940 – $38K (short term bearish .618 Fib) and headed to the support at $34,800 (.5 Fib Retracement) – the lower ascending angle of the triangle.
Yesterday, BTC re-tested that support line again and after breaking out from a short-term rising channel during the time of this writing, made its way back towards $38K and the upper boundary of the symmetrical triangle, at around $38,300.
In case Bitcoin breaks out of the triangle to the bullish side, we can definitely expect a retest of $40K, followed by the ATH levels.
BTC Price Support and Resistance Levels to Watch
Key Support Levels: $37,000, $36,000, $34,800, $34,000, $33,135.
Key Resistance Levels: $37,940 – $39,000, $38,300, $30,000, $39,720, $40,000.
The first level of resistance lies in the range of $37,940 (bearish .618 Fib Retracement) and $38,000. This is closely followed by resistance at the upper boundary of the triangle at $38,300.
The next targets would be $39,000, $39,720 (bearish .786 Fib Retracement), $40,000, and $40,775 (bearish .886 Fib Retracement).
On the other side, the first level of support lies at $37,000. This is followed by $36,000 (.236 Fib Retracement), $34,800 (.5 Fib Retracement & the lower boundary of triangle). Further support lies at $34,000, followed by $33,130 (short term .618 Fib) and $32,500 (.382 Fib).
The daily RSI rebounded from the mid-line, which is in favor of the bulls.
Bitstamp BTC/USD Daily Chart

Bitstamp BTC/USD 4-Hour Chart


