Bitcoin Price Analysis: BTC Withdraws to $47K as Market Anticipates Fed’s FOMC Meeting
Bitcoin was unable to retain any gains above $50K, and the price has subsequently tumbled towards $45K. The cryptocurrency is now trading at around $47K, but the upcoming Fed FOMC meeting tomorrow seems to be causing some sort of fear in the markets.
Option Мarket Аnalysis
Likely because of the upcoming Federal Reserve’s decision on the interest rate on December 15th, the short-term bearish sentiment in the crypto market prevailed. After a sharp drop on December 4th for Bitcoin, it moved higher to reclaim $50k on December 12th.
For now, bitcoin’s price is around $47K. The last two weeks’ Buy/Sell volume filtered for December expiries show lots of Calls at $60k strike being sold. This means that options traders are not optimistic about the short-term. Skew for near-term expiries is pointing towards downside concerns.

Long-term Analysis (Weekly)
On the weekly time frame, the yellow trend line has played a very important resistance/support role in the price history. During the April top, the huge sell-off was in response to this line.
The reaction to the blue trend line is also interesting. These two lines are now crossing each other at $40K and breaking below this level, which would illustrate the power of bears, which means it will not be easy to get it back.

Short-term Analysis
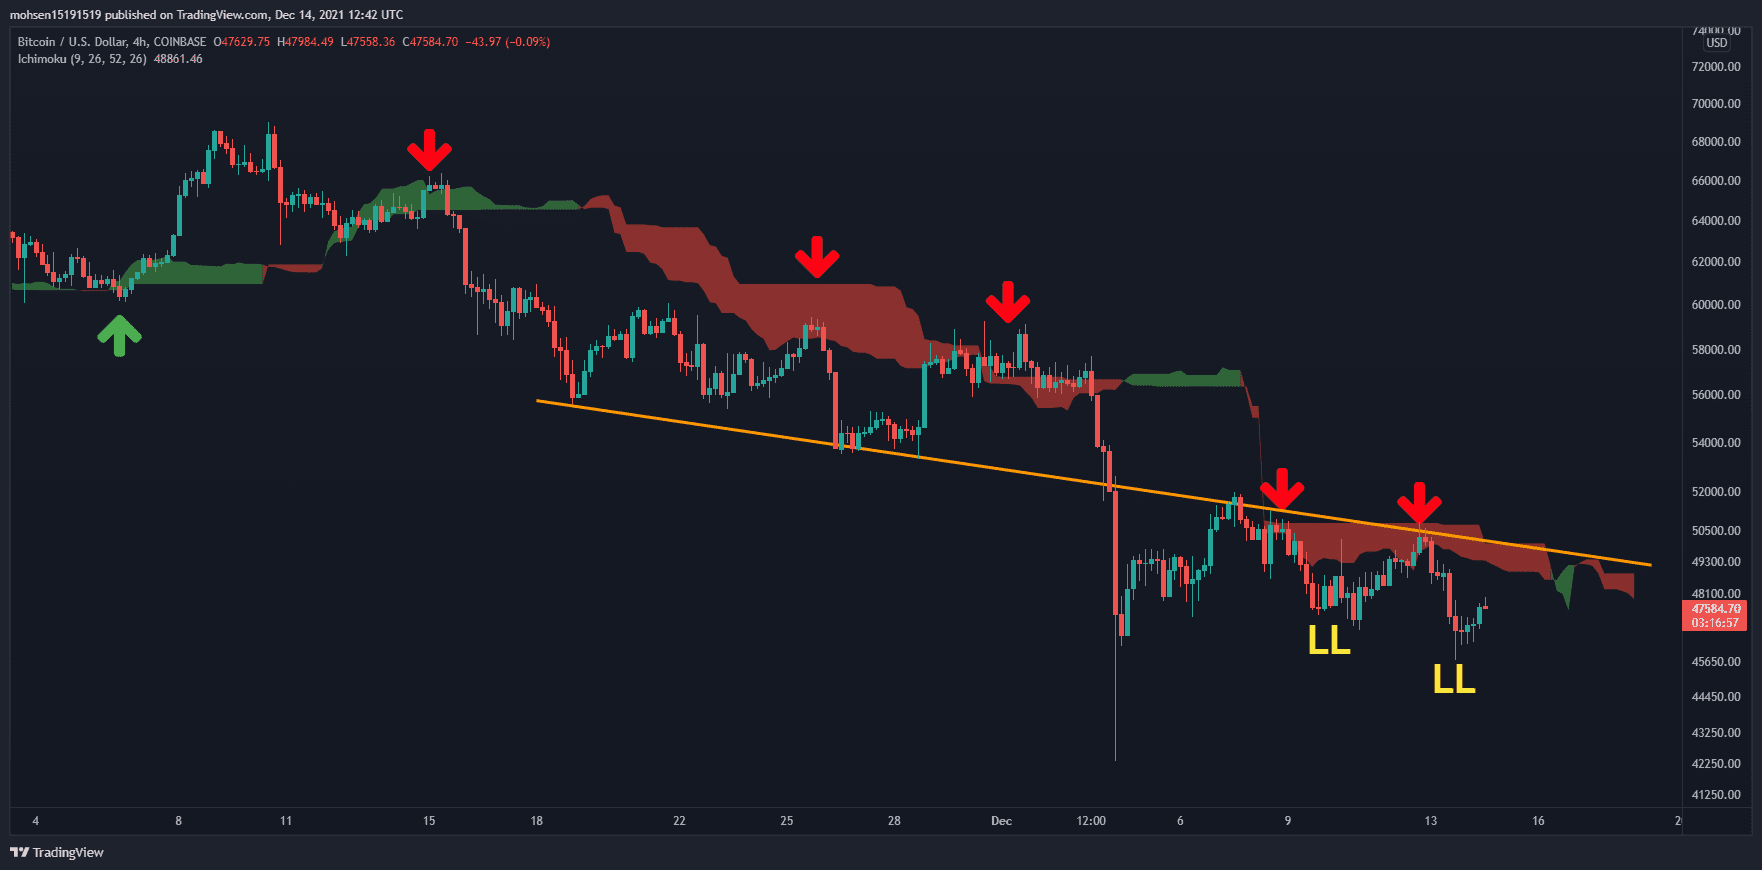
The 4-hour timeframe also does not have a good structure. The bearish trend line and Ichimoku cloud are on the way of Bitcoin to go up and caused prices to form lower low and lower high. Meanwhile, the green candles were weak. The market still seems to be in a state of fear, and tomorrow’s meeting of the Federal Reserve may determine the direction of the trend in the short term.

Onchain Analysis
The classical story of Short-Term (SHT) holder selling in loss is still in play. As expected, the main sellers in the last seven days were the SHT-Holders. ~60% of these sellers had a cost basis between $49-$69K (purple). The selling pressure was mainly adsorbed at $47-$49K (pink).

The above analysis was complied by @N__E__D__A, @GrizzlyBTClover, and @CryptoVizArt. Data provided by @tsypruyan exclusively for CryptoPotato.


