Bitcoin Price Analysis: BTC Surges $800 Back To $8K – A New 2019 High Soon?
Corrections are part of the game. Two days ago, when publishing our recent analysis, we saw Bitcoin correcting violently down, even touching $6300 on some exchanges. This was anticipated following the surge from $5000 that went only in one direction.
If someone is looking for strength in the BTC market, he would definitely find it at recent hours’ Bitcoin behavior. The volatile coin had gone through a fabulous $800 bullish run, and now testing $8000 again.
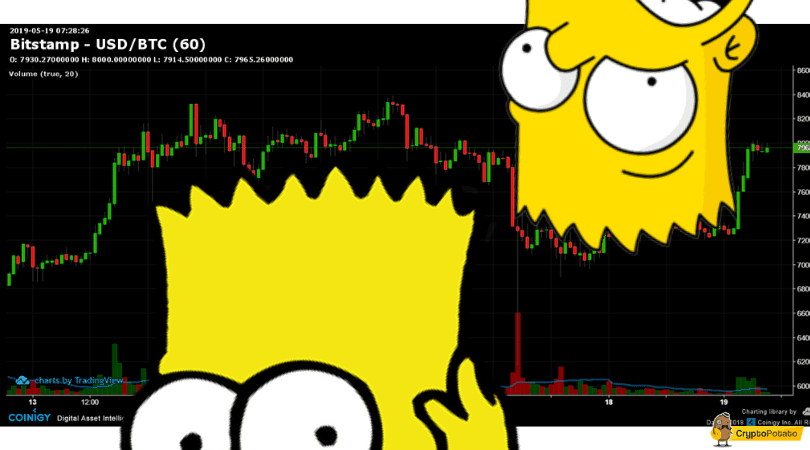
Lastly, and not for the first time, this is for sure Bitcoin’s favorite TV show:
Total Market Cap: $249 Billion
Bitcoin Market Cap: $140.9 Billion
BTC Dominance: 56.6%
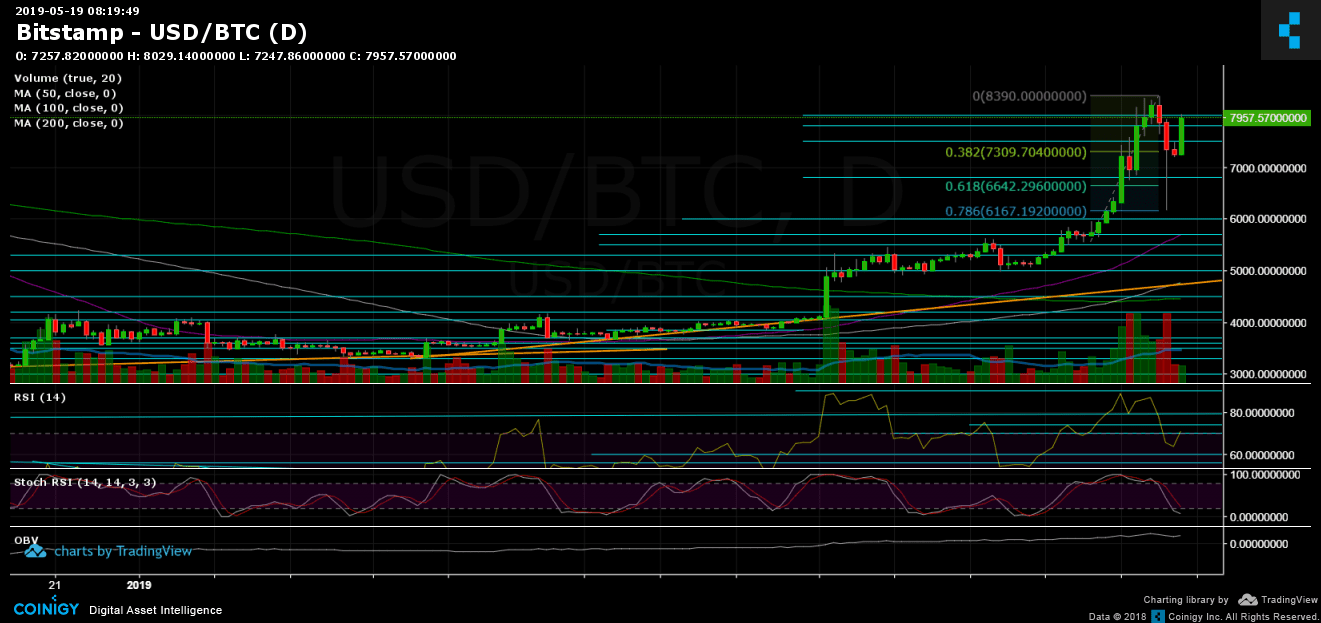
Looking at the 1-day & 4-hour charts
– Support/Resistance:
From above, Bitcoin is now facing the $8000 resistance again. If Bitcoin succeeds in breaking, we would expect a retest of $8200 and 2019 high at $8400. Breaking up and $8500, $8800 and $9000 will become the next targets for the cryptocurrency.
From below, after the $7000 and $7250 – $7300 had proven to be strong support area, from below there is also the $7800 and $7600 support levels before reaching to the mentioned area.
– Trading Volume: The recent days had seen very high volume (and high volatility). The daily volume levels are starting to look like December 2018 numbers.
– Daily chart’s RSI: The RSI had also encountered a resistance zone of 70 – 73. However, a bullish sign might be coming from the Stochastic RSI oscillator. The last is moving toward a crossover in the oversold area; this can fuel up the market and assist in breaking up the $8000.
– BitFinex open short positions: Following the severe 40% drop of the short positions and the long squeeze, the shorts are slowly climbing and now stand on 17.6K BTC open short positions.
BTC/USD BitStamp 4-Hour Chart
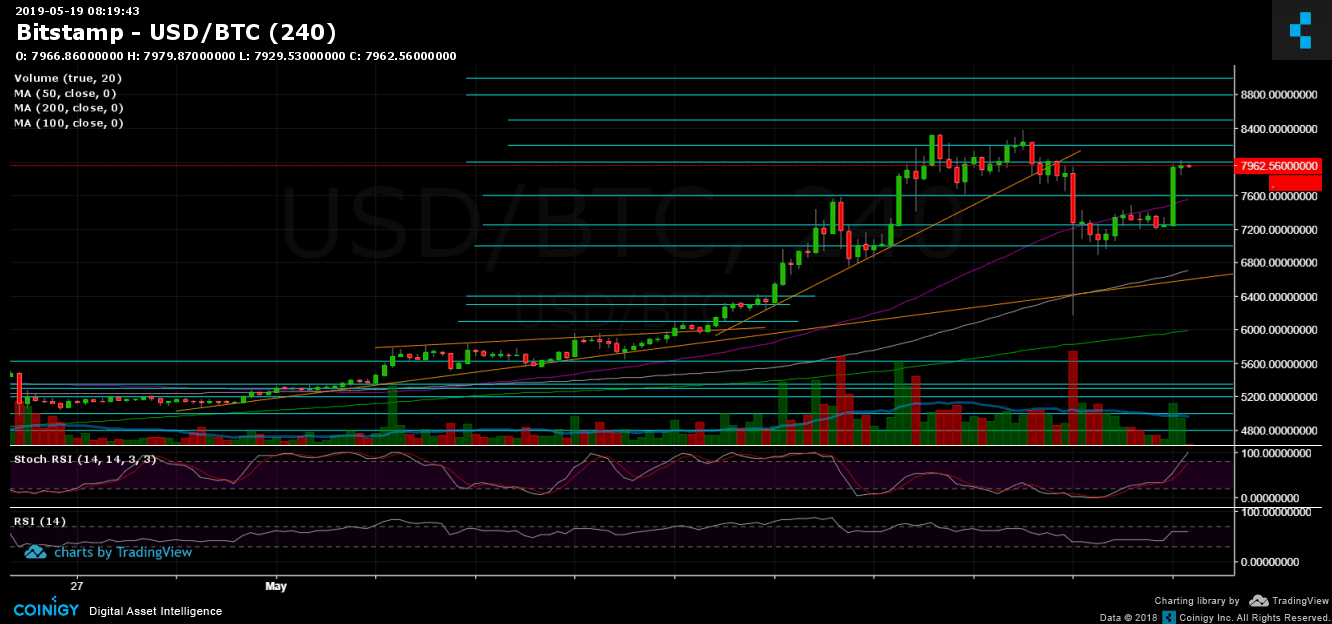
BTC/USD BitStamp 1-Day Chart
The post Bitcoin Price Analysis: BTC Surges $800 Back To $8K – A New 2019 High Soon? appeared first on CryptoPotato.