Bitcoin Price Analysis: BTC Surge Continues, Will We See a New 2019 High Soon?
Following our recent price analysis from two days ago, where Bitcoin broke above the mid-term triangle formation at approximately $11,600, the king of the cryptocurrencies ignited its engines!
Following the breakout, the parabolic action continued, and after reaching quickly to $12,000 just two days ago, $13,000 was reached hours ago.
As of writing this, it seems like the Bitcoin party is far from its end – the RSI looks nice and bullish, the volume of the buyers is supporting the trend, and also the daily Tether printing, that already proved its relationship to the surging Bitcoin.
However, such volatility can trigger deep corrections, and 10% surge can quickly end up in a correction of that size to the bearish direction. Also, Bitcoin is getting to be very close to the 2019 high zone ($13,880), which is also a legendary long-term Fibonacci retracement level. This will be interesting for sure.
Total Market Cap: $353 billion
Bitcoin Market Cap: $229.3 billion
BTC Dominance Index: 64.9%
*Data by CoinGecko
Now What?
– Support/Resistance:
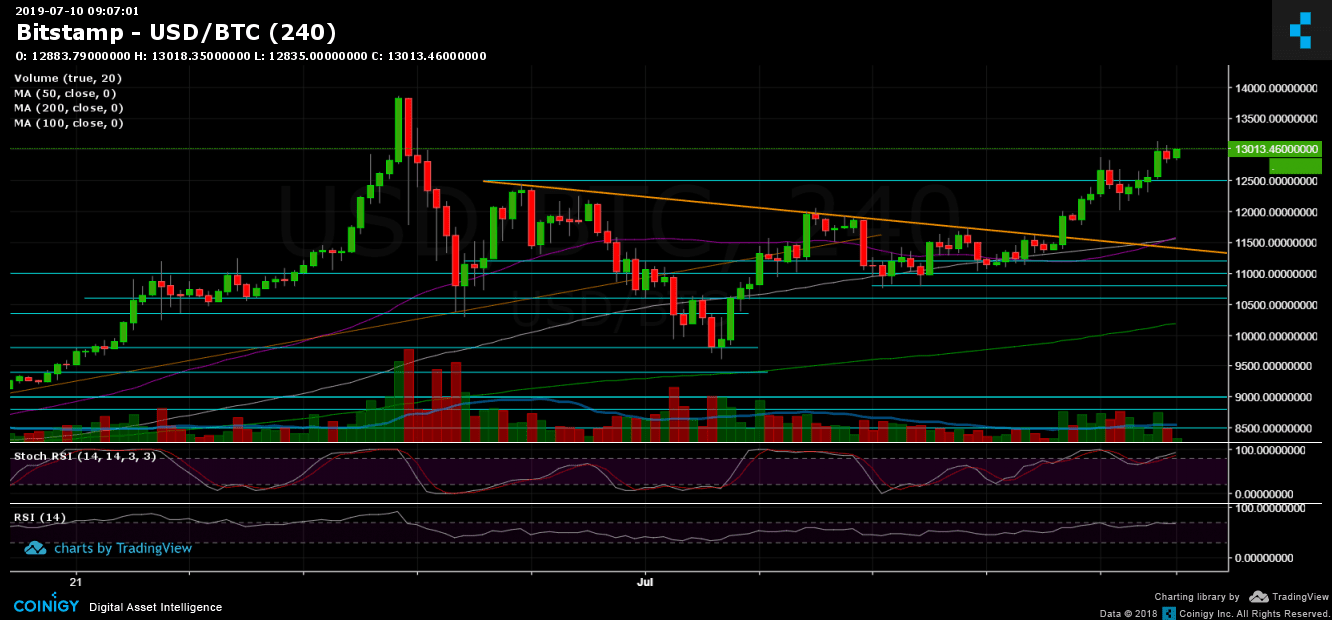
After consolidation period for the last day around the $12,500 resistance, Bitcoin finally made a move and recorded $13,150 (BitStamp) as its daily high. As of writing this, the coin is still facing the $13,000 resistance area. Breaking up, and Bitcoin is then aiming for the 2019 current high at $13,500 – $13,880.
The last could be an obstacle for Bitcoin, and in the case of a breakout, the road to the $20,000 all-time high will become reachable, from the fact that there is not much of resistance along the way.
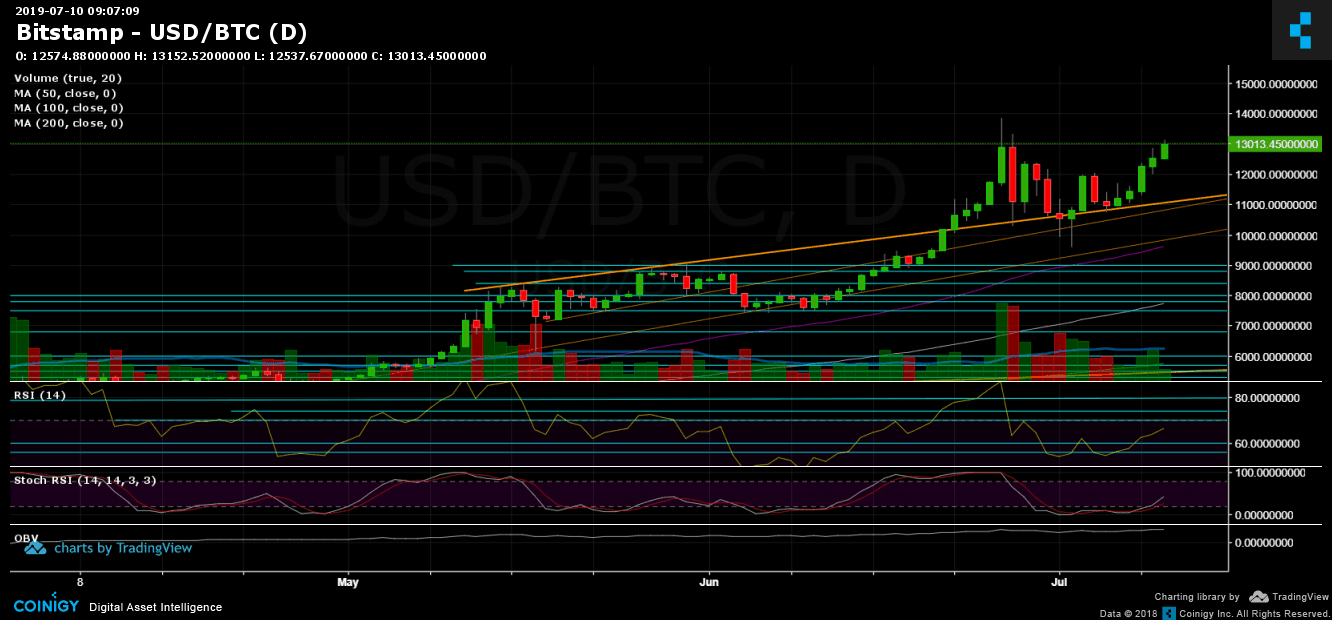
From below, the nearest support now lies at $12,500, and then $12,200 and $12,000. Further below is the breakout zone, which is considered a substantial demand area at around $11,500 – $11,600. Further below is $11,200 (along with the daily chart’s ascending trend-line, marked in orange) and $10,800.
– Daily chart’s RSI: The RSI did prove a bullish momentum and invalidated the negative divergence, breaking above the last local top at 62. As of now, the RSI will be facing the 70 resistance level. The Stochastic RSI oscillator has done a cross-over and did enter the bullish territory (as mentioned on our previous analysis).
– Trading Volume: a beautiful green candle of buyer’s volume supported the current spike. However, we are still not in the levels of the past $13,800 capture.
– BitFinex open short positions: Following the spike, many traders opened new short positions: There are now 14.6K BTC short positions.
BTC/USD BitStamp 4-Hour Chart
BTC/USD BitStamp 1-Day Chart
The post Bitcoin Price Analysis: BTC Surge Continues, Will We See a New 2019 High Soon? appeared first on CryptoPotato.