Bitcoin Price Analysis: BTC Spikes $2,000 In an Impressive 24-Hours Correction, Will It Last?
A Lot of price action surrounding Bitcoin in the past few days. After the massive decline from the $12,000 area to $9,614 (Bitstamp), then comes a bullish correction, and what a correction. In less than a day, Bitcoin gained almost $2,000 to its value, to retest crucial support turned resistance area.
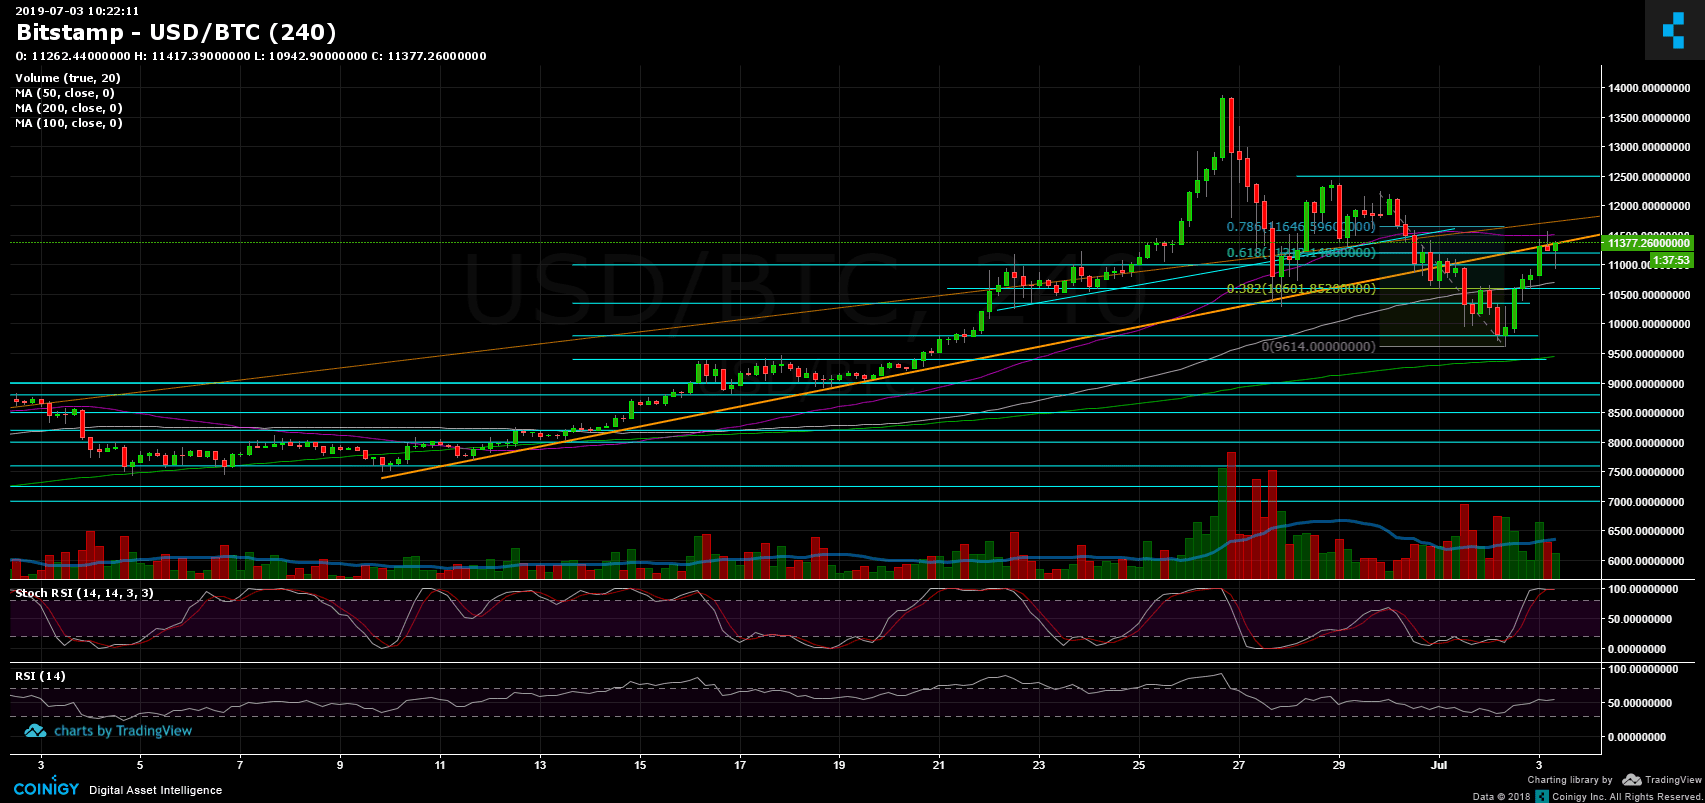
What was truly impressive is the strength of the market. Any Bitcoin under $10,000 bought very quickly. However, as can be seen on the 4-hour chart, Bitcoin reached crucial resistance area at the mid-term ascending trend-line (marked in orange). This is the first test of the cryptocurrency in its way back up.
Total Market Cap: $322 billion
Bitcoin Market Cap: $200 billion
BTC Dominance Index: 62.1% (Yesterday, we pointed out the 60% BTC dominance support. This was another sign for a possible bullish move)
*Data by CoinGecko
Now What?
– Support/Resistance:
Bitcoin is now facing two critical resistance levels: $11,200 and $11,500, along with those mentioned above, there is the ascending trend-line resistance and the 61.8% Fib retracement level. Breaking up, and the coin is likely to reach the next resistance area from a week ago at $12,000 – $12,200. Further above lies $12,500 before the 2019 high at $13,500 – $13,880.
From below, the nearest support lies at $11,000 before the $10,800 support level. Further below is $10,600, $10,300 and $9800. Then, lies the low from yesterday at $9600. As been said here yesterday, and only to my opinion, the $9400 area will still be considered as a healthy correction to the recent parabolic move (that lasted up to $13,880).
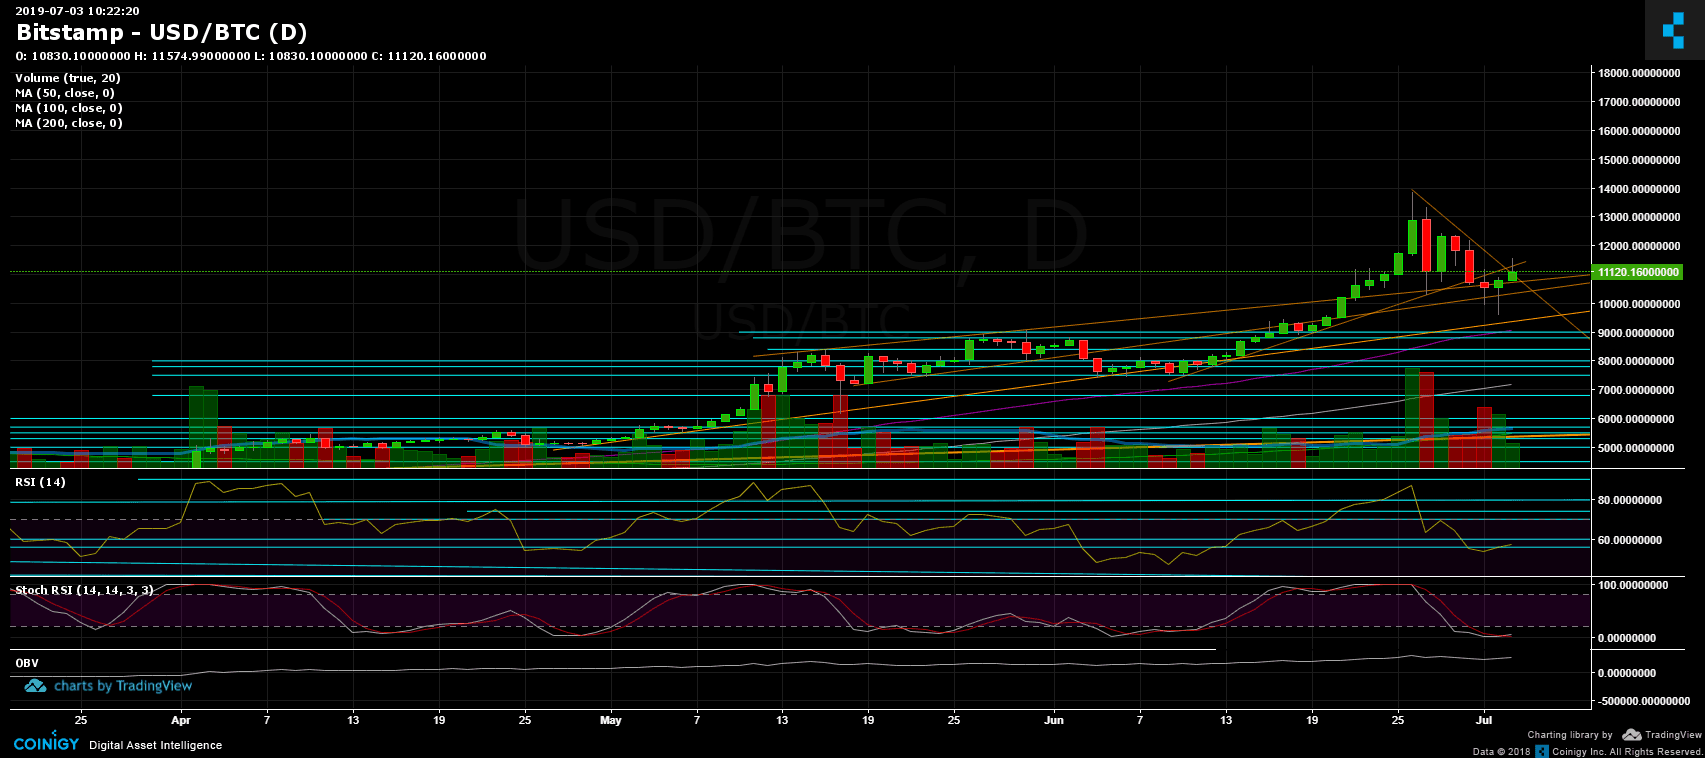
– Daily chart’s RSI: The RSI found support at the 50 level and is now hovering at the bullish territory. Following yesterday’s analysis, the Stochastic RSI oscillator has made the anticipated cross-over to the bullish side and is about to enter the bullish territory.
– Trading Volume: Looking at the daily candle of yesterday, along with the volume, it is definitely a strong sign for the bulls. However, the volume levels are still far from the last week’s peak.
– BitFinex open short positions: Following the odd drop in shorts, the number of open positions is now 9.5K BTC positions, which is another 6% daily drop. This is not far (9.2K) from the 2-year low at 9.2K (January 2018).
BTC/USD BitStamp 4-Hour Chart
BTC/USD BitStamp 1-Day Chart
The post Bitcoin Price Analysis: BTC Spikes $2,000 In an Impressive 24-Hours Correction, Will It Last? appeared first on CryptoPotato.