Bitcoin’s price has finally broken above the $45K mark on its path toward creating a new all-time high. While the technical chart looks strong, there are some worrying signals arising from on-chain metrics.
Technical Analysis
By TradingRage
The Daily Chart
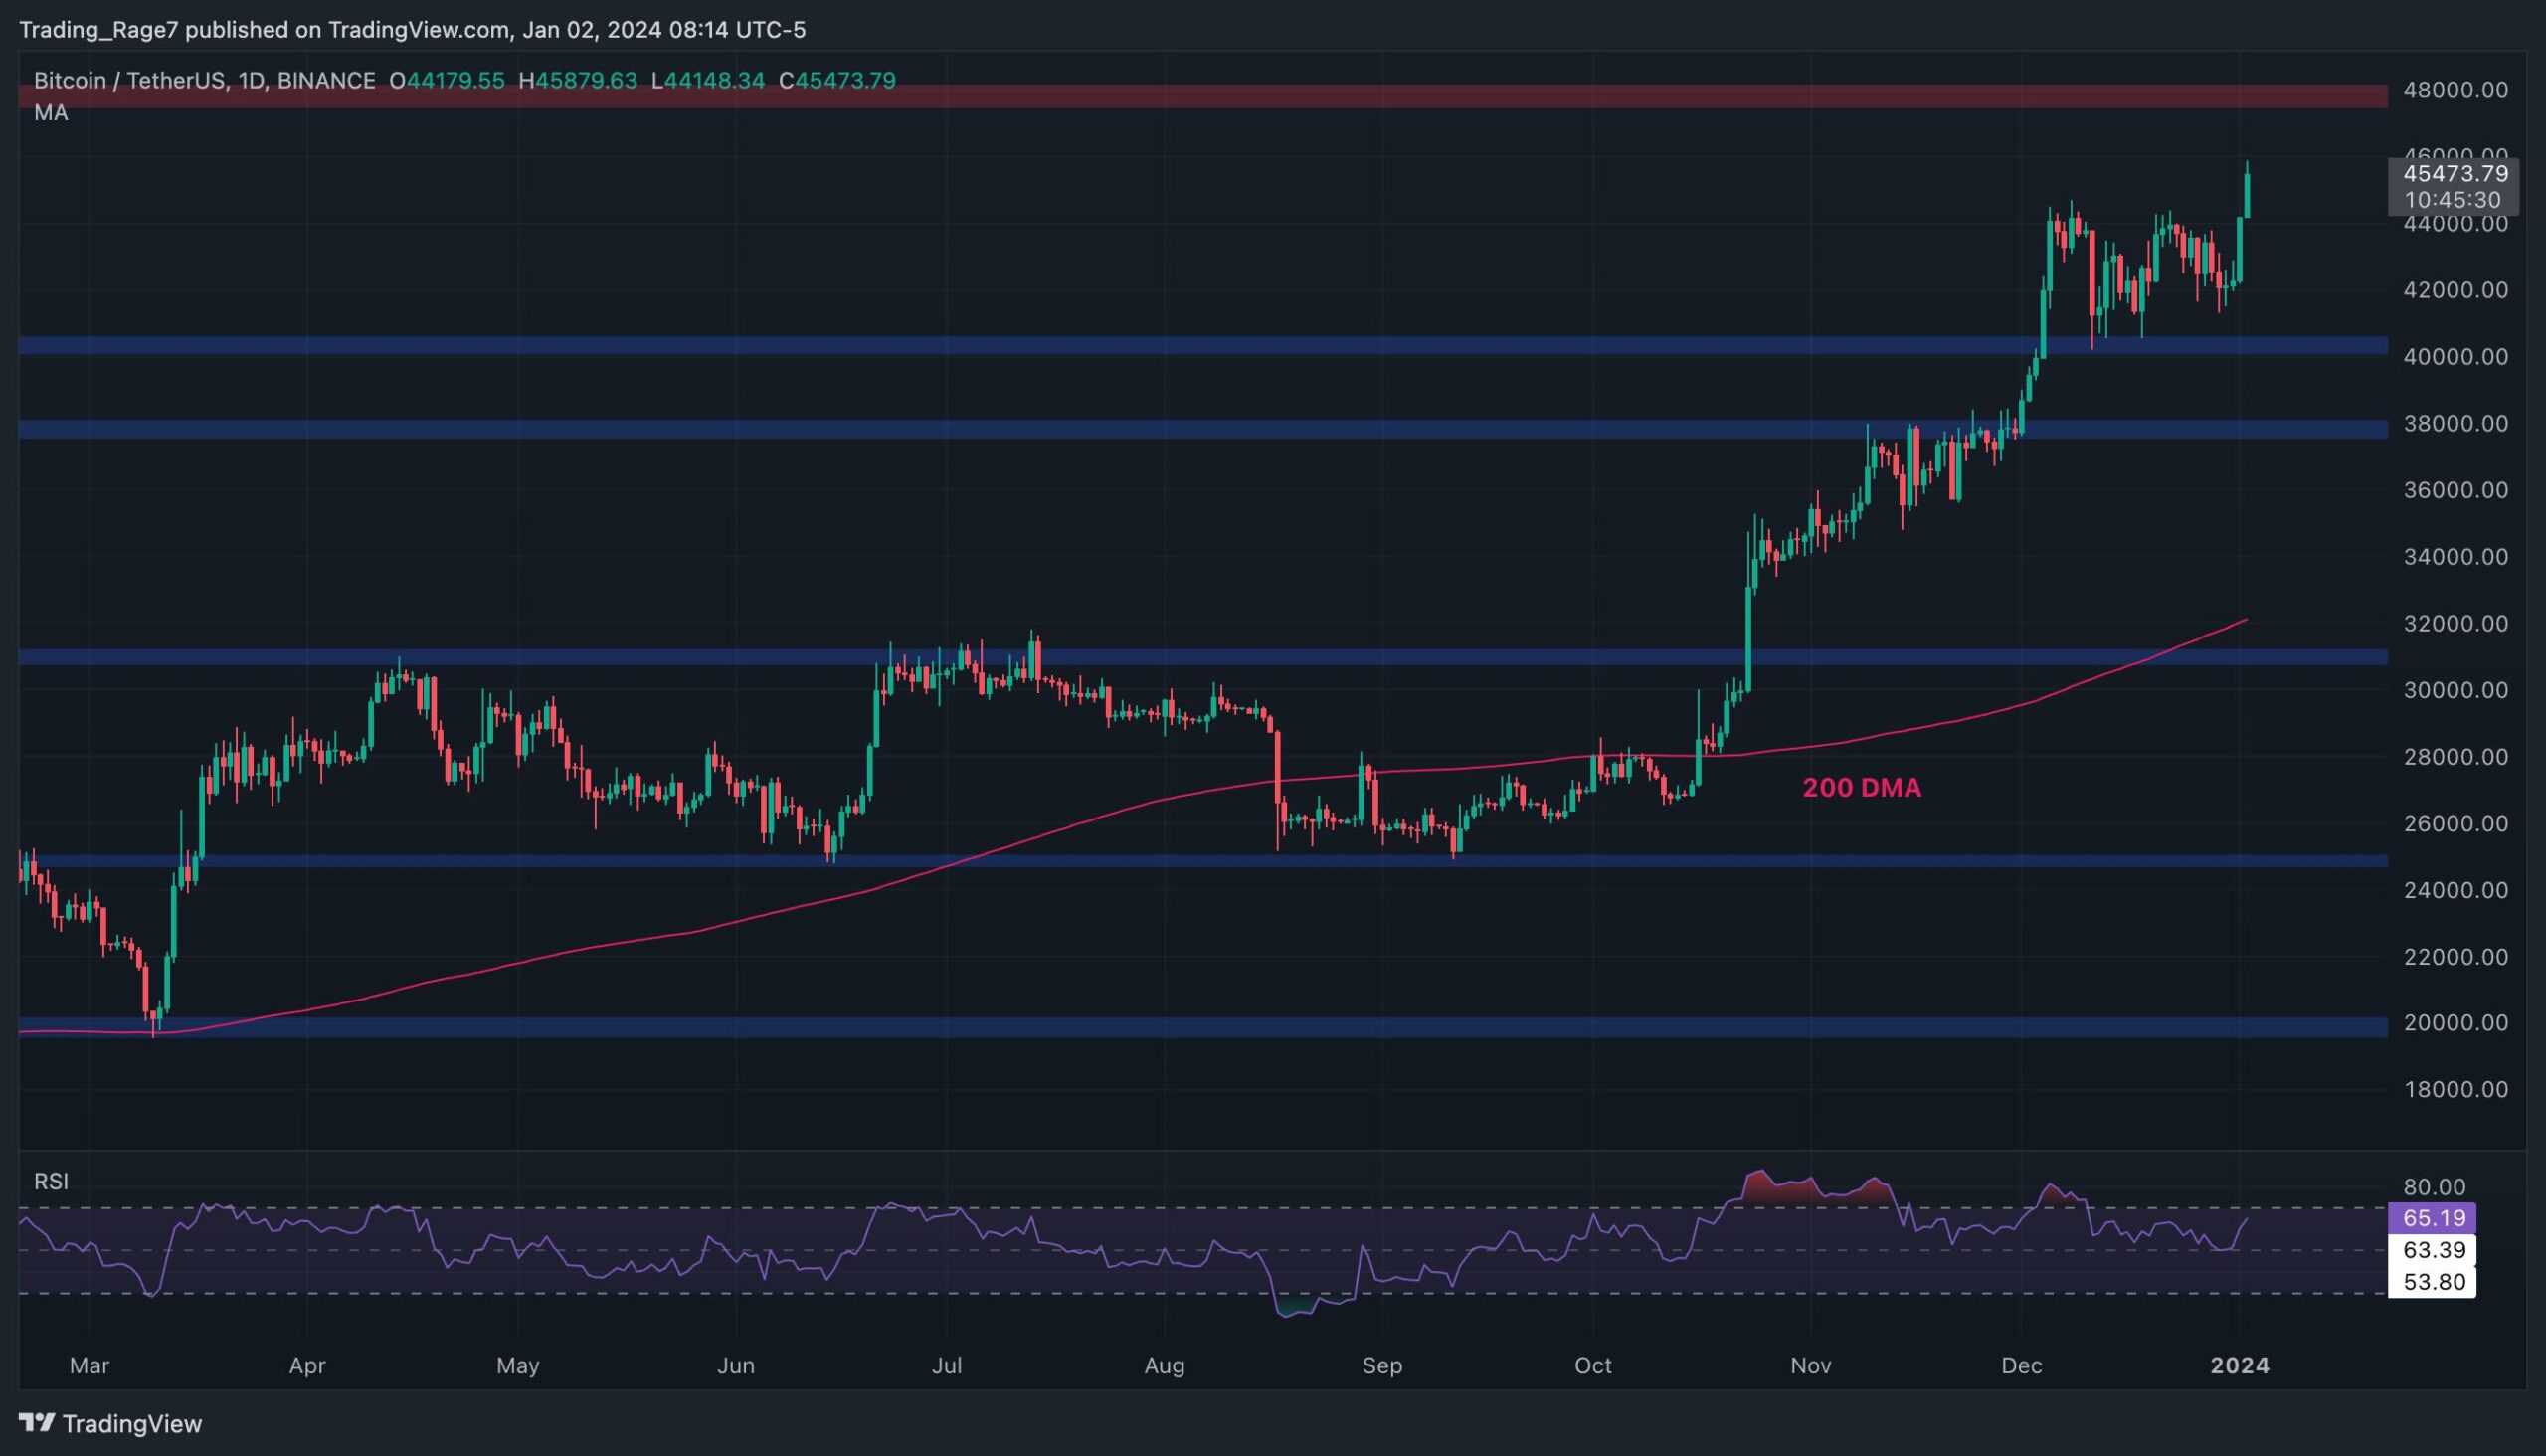
On the daily timeframe, the price has clearly been bullish for the last few months. Following the breakout above the $40K level, the market has gone through a consolidation phase. However, the $40K area has acted as a formidable support level, pushing the price even higher.
BTC is approaching the $48K resistance level, which is the next significant obstacle. If it is broken to the upside, the probability of witnessing a new all-time high in 2024 will considerably increase.
Source: TradingView
The 4-Hour Chart
The 4-hour chart presents a clearer picture of the recent action. The price has formed a symmetrical triangle after pushing above the $40K mark.
However, it recently broke the triangle to the upside with astonishing momentum. From a classical price action standpoint, the cryptocurrency is looking primed to reach the $48K level soon. However, the Relative Strength Index is demonstrating a caution signal as it has entered the overbought region in the 4-hour timeframe.
Therefore, the market could consolidate or even pull back in the short term before continuing toward the $48K zone.
Source: TradingView
On-Chain Analysis
By TradingRage
Bitcoin Miner Reserve
While Bitcoin’s price has been rallying aggressively over the last couple of months, not all market participants are overly optimistic about the future. The most significant cohort on the Bitcoin network, miners, are demonstrating worrying behavior.
This chart depicts the miner reserves metric, which measures the amount of BTC held on miner wallets. An increase in the miner reserves shows accumulation by the miners, while a decrease points to distribution by them.
It is evident that during the last couple of months, amid the considerable surge in price, the miner reserve metric has been dropping rapidly. This indicates that the miners are using the newly introduced demand as an exit opportunity.
They are consistently selling their holdings to buyers. The resulting selling pressure could lead to a bearish price reversal if demand shrinks in the near term.
Source: CryptoQuant
The post Bitcoin Price Analysis: BTC Skyrockets to $46K but Worrying Signs Appear appeared first on CryptoPotato.
[PRESS RELEASE – Singapore, Singapore, 27th May 2021] Jigstack ($STAK), a leading decentralized autonomous organization (DAO) that is governing a portfolio of Ethereum network assets and protocols is now listed on HitBTC, a leading European cryptocurrency exchange that offers a high level of liquidity. This marks a new beginning for the STAK token which is…
What started as a joke cryptocurrency is now becoming a serious investment for retail traders. Shiba Inu (SHIB) has made tremendous gains in the past month – outperforming other cryptocurrencies and hitting consecutive all-time high records with the latest at over $0.000068 earlier on October 27th. Another ATH for SHIB The crypto meme, which promised…
[PRESS RELEASE – Please Read Disclaimer] Credefi – an innovative hybrid of FinTech Solution and DeFi Protocol connecting crypto lenders with small & medium business borrowers from the traditional economy, announced today it has closed $1.8 million in private financing as part of a successful funding stage that garnered significant interest from a variety of…
XRP is the best-performing cryptocurrency in the past seven days, and it’s not even close. Trading at around $0.50, it’s up by more than 50%, leaving all other major altcoins in the dust. This has had the entire community speculating on possible reasons, so we take a look at two of them that might have…
Mexican senator for the State of Nuevo León, Indira Kempis, has stated that she wants to make the country second after El Salvador to adopt Bitcoin. However, the chances of this actually happening are slim at best. Speaking to local media this week, she noted that she aims to promote the use of Bitcoin in…
Gamma Strategies – a DeFi protocol built on the Ethereum blockchain – fell victim to an exploit, resulting in a loss of approximately $3.4 million. In response to the attack, the protocol swiftly implemented measures to prevent further losses, temporarily disabling deposits to all public DeFi vaults while keeping withdrawals active for users in need
Over the past 90 days, bitcoin (BTC) has been in a state of consolidation, hovering between the $91,000 and $102,000 range. Analysts at the crypto exchange Bitfinex have revealed that the cryptocurrency is currently at a “critical juncture” after this prolonged trading pattern. According to the market experts, Bitcoin’s next major move will likely be
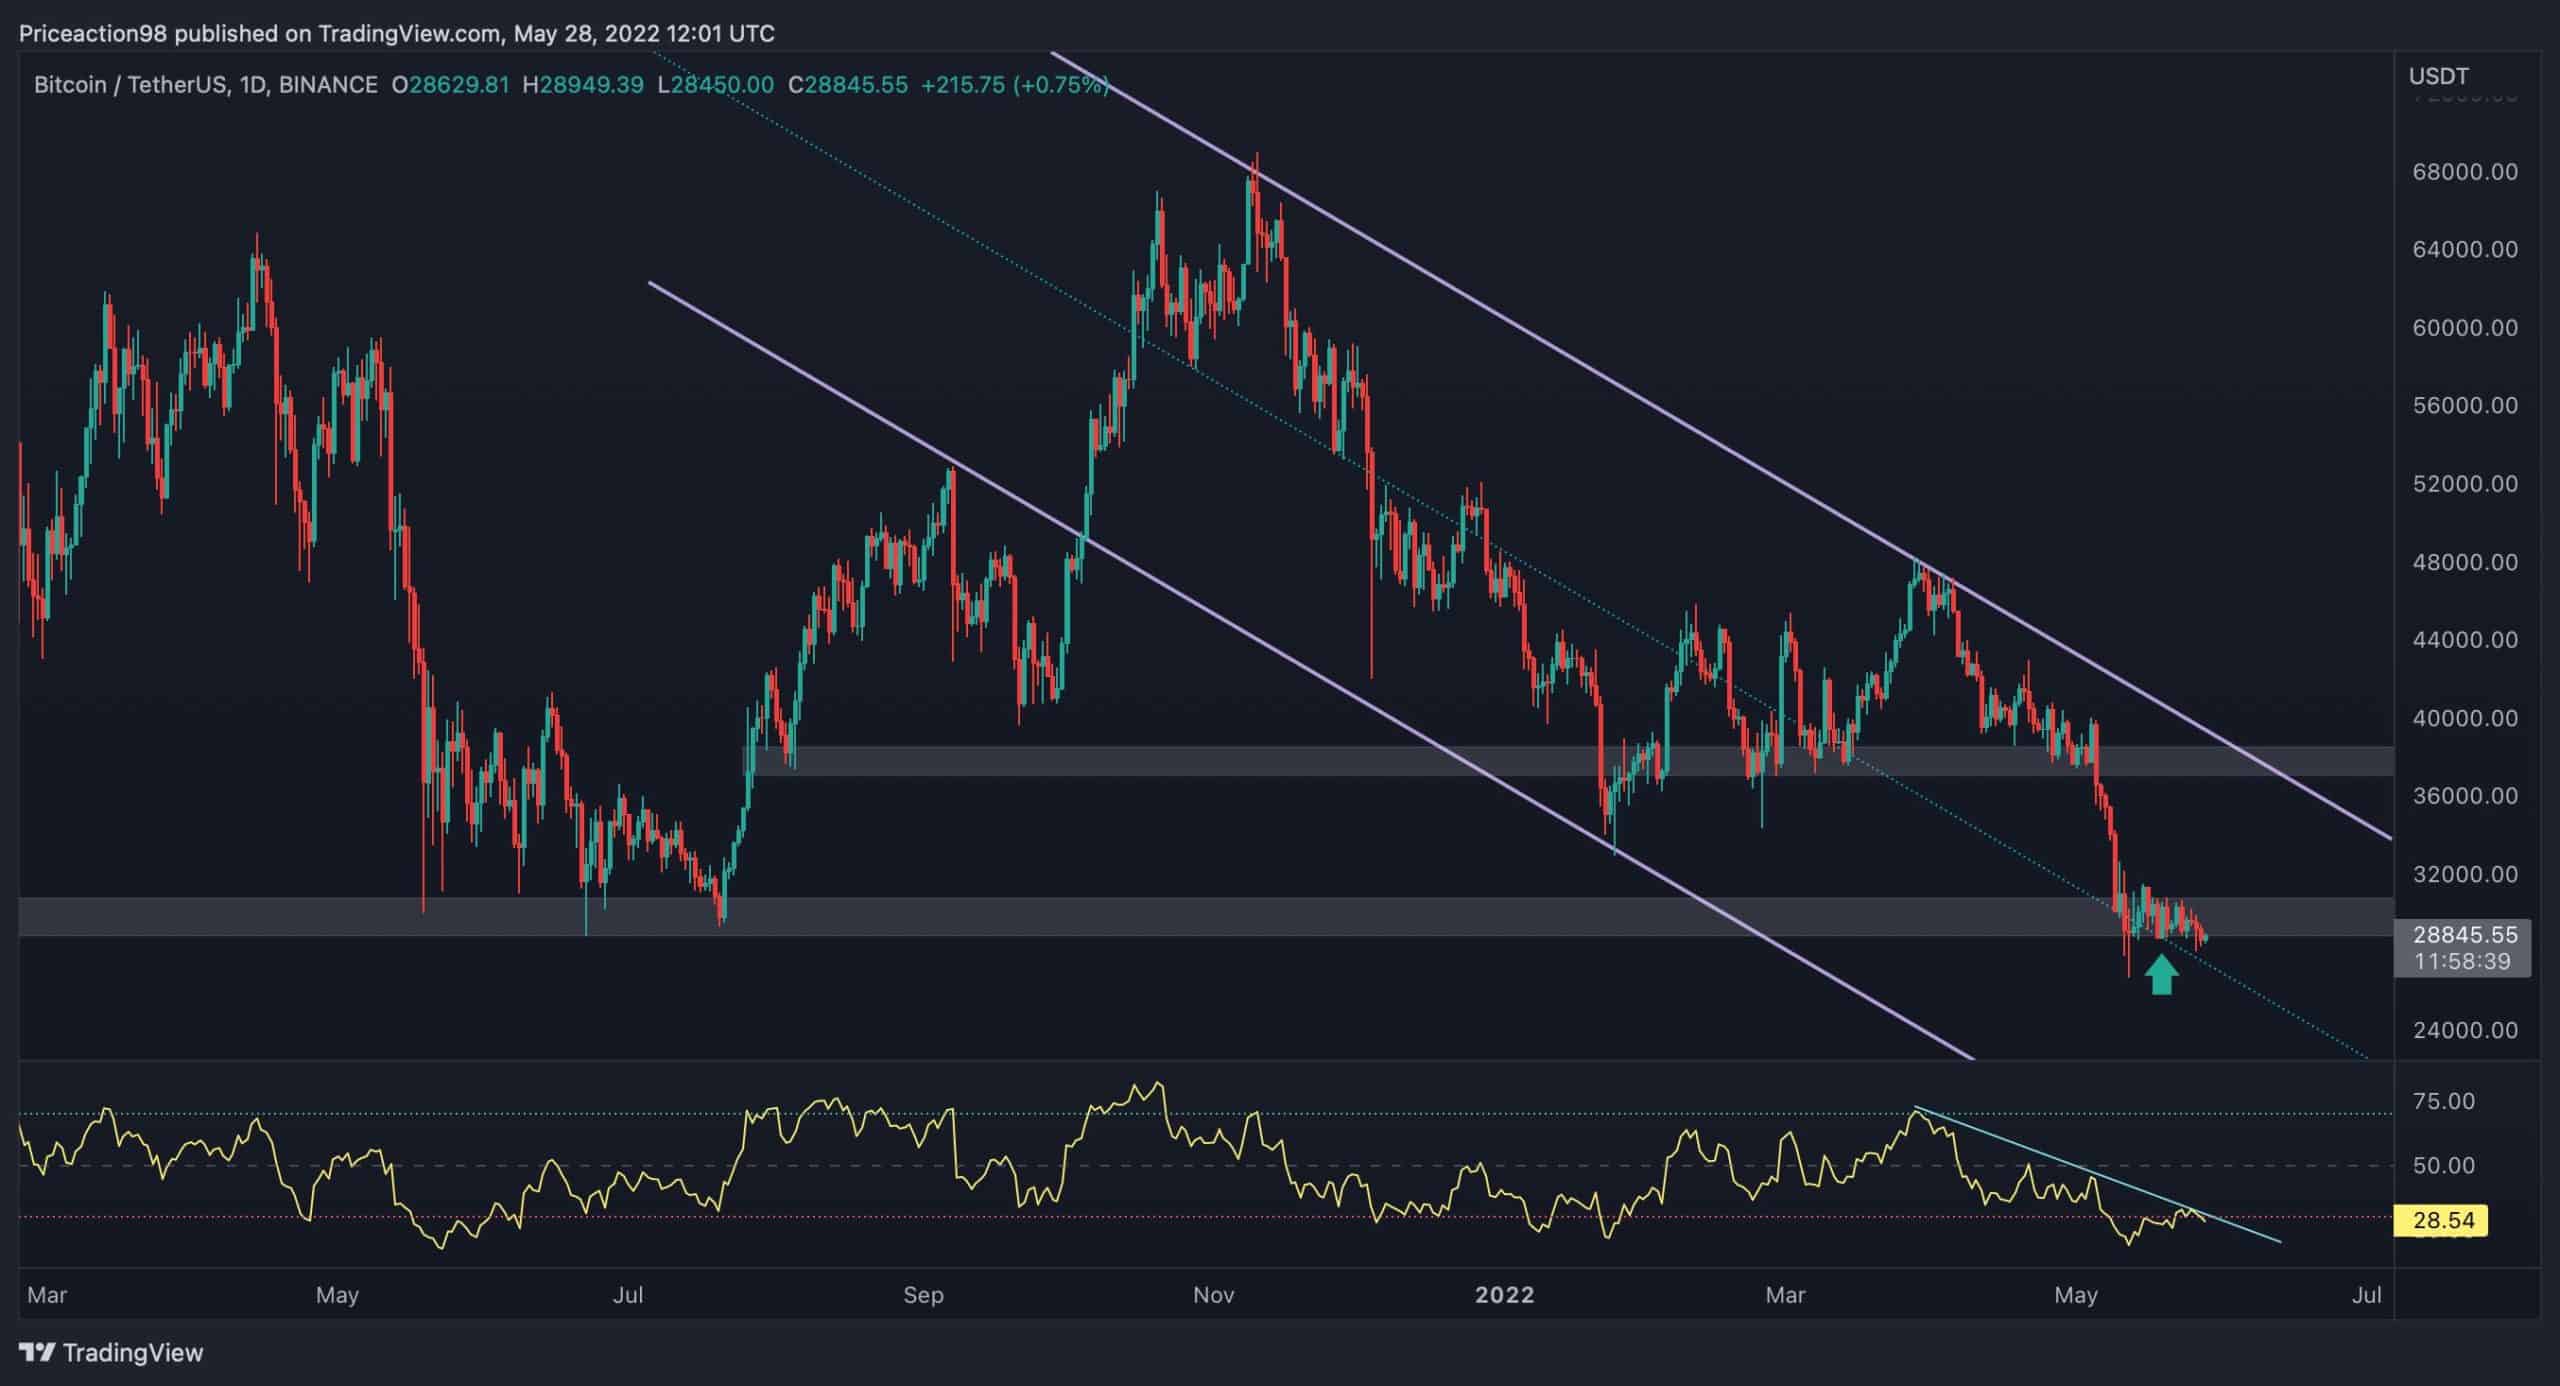
A descending channel has accompanied Bitcoin’s price since setting a new all-time high of $69K, clearly indicating a bearish phase. The following is aimed at investigating and evaluating possible scenarios in the mid-and short term. Technical Analysis By Shayan The Daily Chart The price is now consolidating above the middle trendline of the channel. The…
The tech world thrives on innovation, and staying ahead of the curve can feel like a constant sprint. But what if you could tap into a network of groundbreaking projects, all pushing the boundaries of blockchain technology? XERA Pro offers just that – a curated platform connecting you with the future of tech. Here’s how