Bitcoin Price Analysis: BTC Showing Weakness, Struggling For $10,000. New Lows Coming Up?
Since reaching the $11K resistance area three days ago, we saw Bitcoin slowly decreasing over the past days. As of writing these lines, the crypto king struggles to maintain the 5-digit price region.
As we stated in our previous analysis, the $11K was the real test for the bulls and failing to break above means one thing – the bears are in control of the market. This is exactly what had happened.
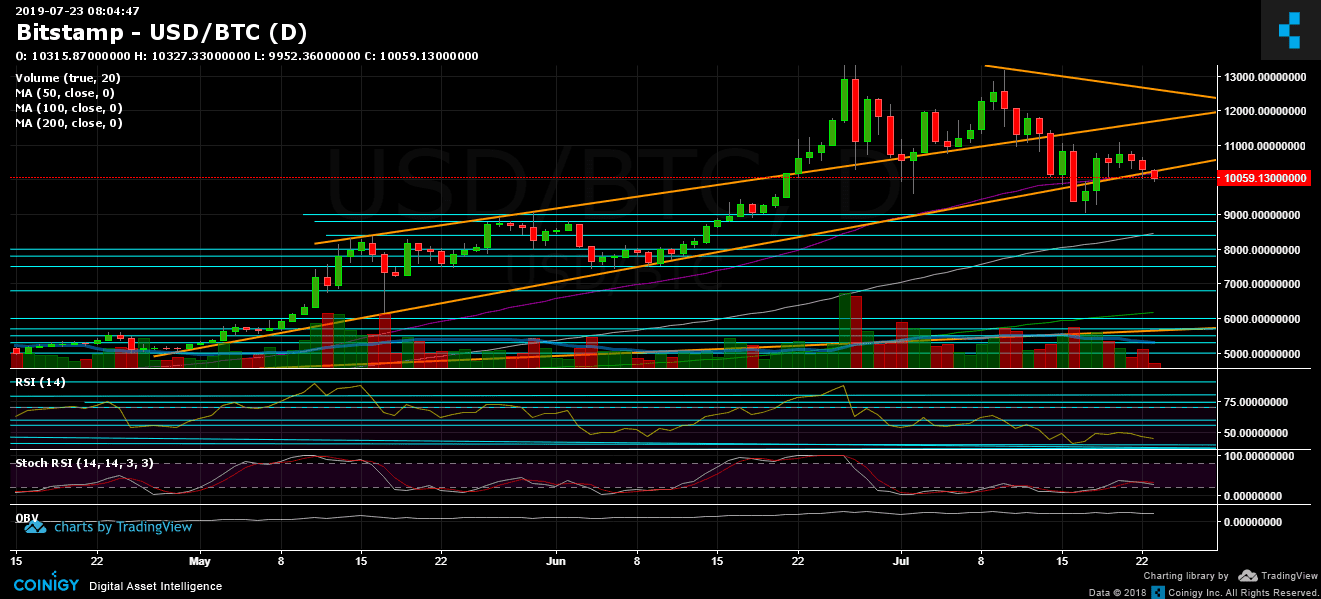
Looking at the bigger picture, Bitcoin is about to breakdown the critical mid-term ascending trend-line (on the daily chart), which started forming since May 2019.
As can be seen, since reaching the 2019 high at $13,880, the coin is producing lower highs pattern, which is bearish. Hence, the first test to revert the trend is the $11,000 area (as mentioned above).
Remember, trading under those uncertain market conditions sometimes can be tough and frustrating.
Total Market Cap: $274 billion
Bitcoin Market Cap: $179 billion
BTC Dominance Index: 65.1%
*Data by CoinGecko
Key Levels to Watch
– Support/Resistance:
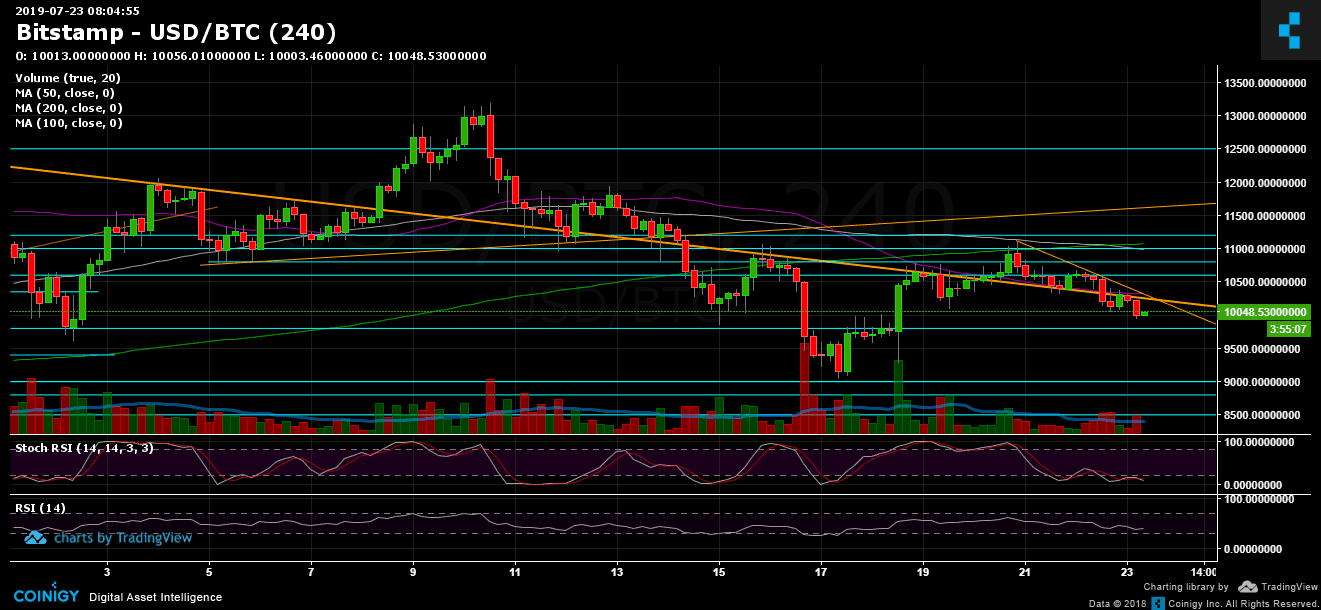
Bitcoin is now struggling to stay on top of the $10,000 support area. Breaking down and the next immediate targets are $9,800, $9,600 and $9,400. Further below is $9,000 (which is the low from the past week), $8800 and $8500 significant support line (along with CME’s futures gap).
From the bullish side, the first resistance is now the 50-days moving average line (marked in purple) which is roughly around $10,200. Further above is $10,500 – $10,600 area, before the $10,800 and the problematic $11,000 region.
– Daily chart’s RSI: The RSI is showing weakness. Over the past days, the RSI couldn’t overcome the 50 levels, and as of writing this, the indicator is hovering at the bearish territory, and there is large space to go further down. The Stochastic RSI oscillator is at its oversold area, however, looking very bearish as well.
– Trading Volume: Over the past four days, since reaching the $11,000 weekly peak, the volume has been boring and low. Not much interest, traders are waiting aside. Besides, the news coming from US exchanges’ investigations can explain some of it.
BTC/USD BitStamp 4-Hour Chart
BTC/USD BitStamp 1-Day Chart
The post Bitcoin Price Analysis: BTC Showing Weakness, Struggling For $10,000. New Lows Coming Up? appeared first on CryptoPotato.