Bitcoin Price Analysis: BTC Retraces From $35K, Cool-off Before Another ATH or Correction Inbound?
The BTC ongoing bull run is still intact as the primary cryptocurrency records an unbelievable 75% price explosion over the past month alone.
During the past 24 hours, the Bitcoin price saw another 6% increase and is currently trading around $33,500. Like the past days, Bitcoin recorded another fresh all-time at $34,810 (Coinbase price).
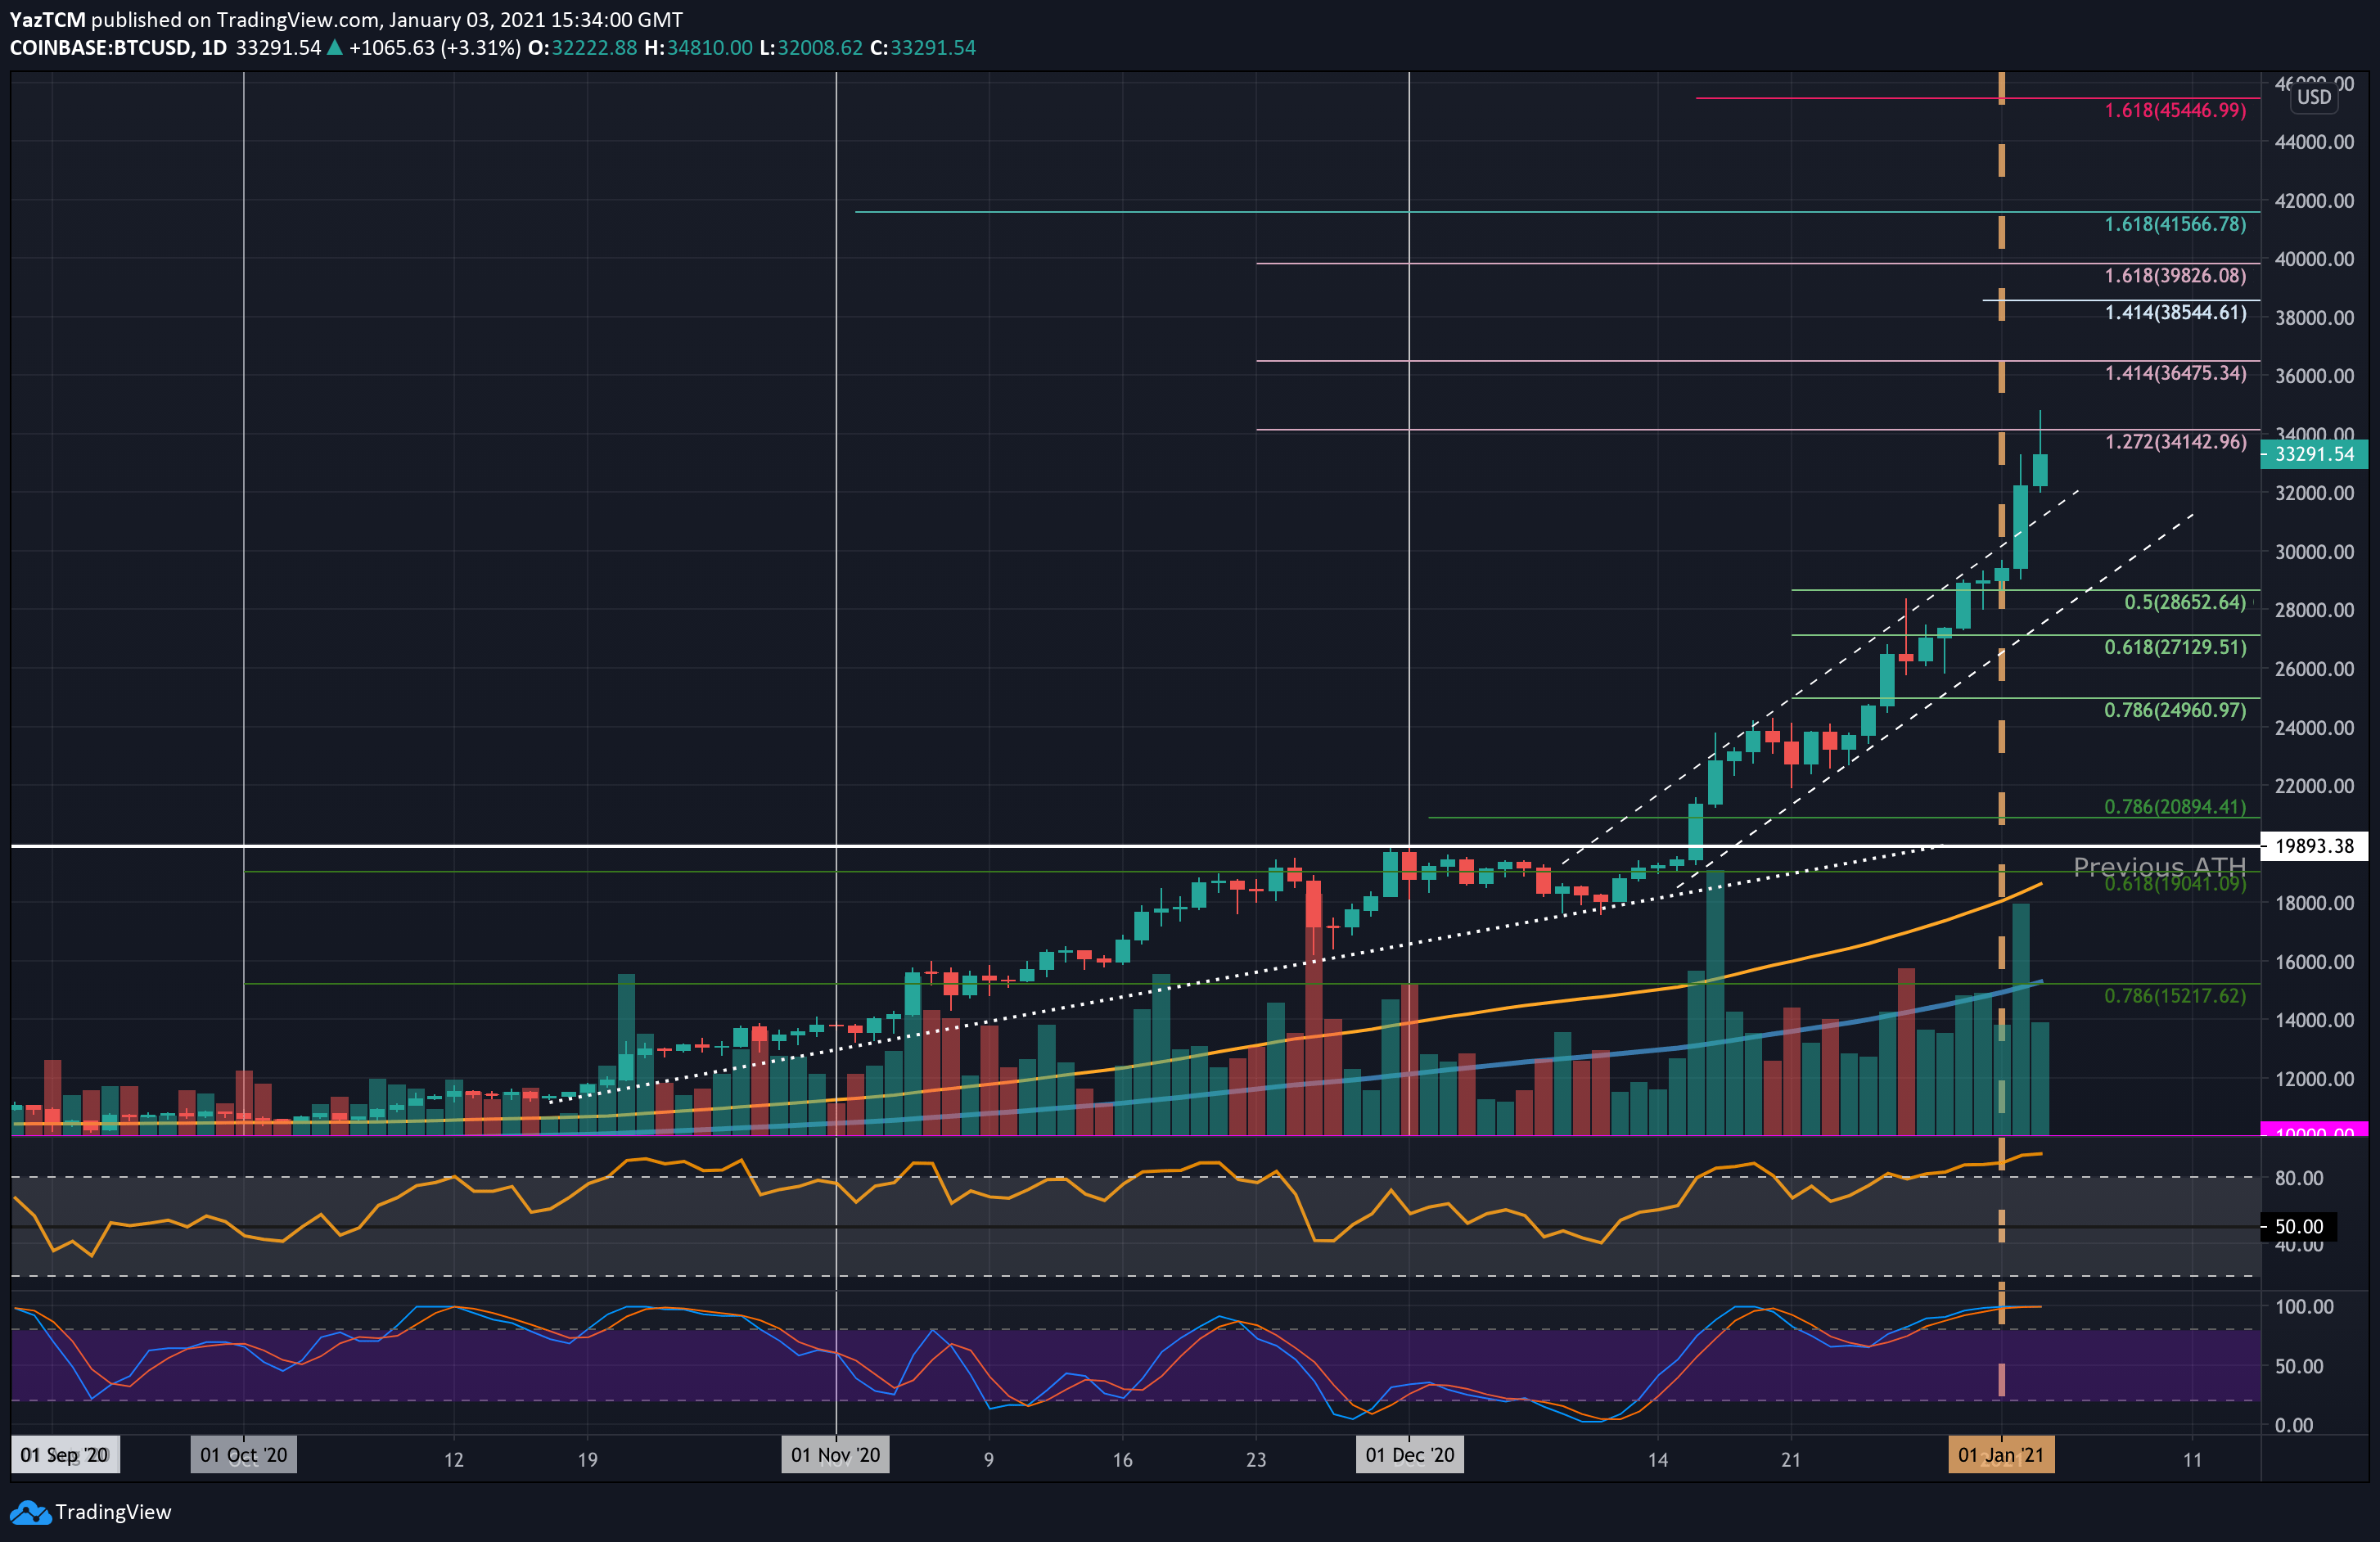
As mentioned here yesterday, BTC went extremely parabolic after breaking above the upper boundary of a 3-week long ascending price channel.
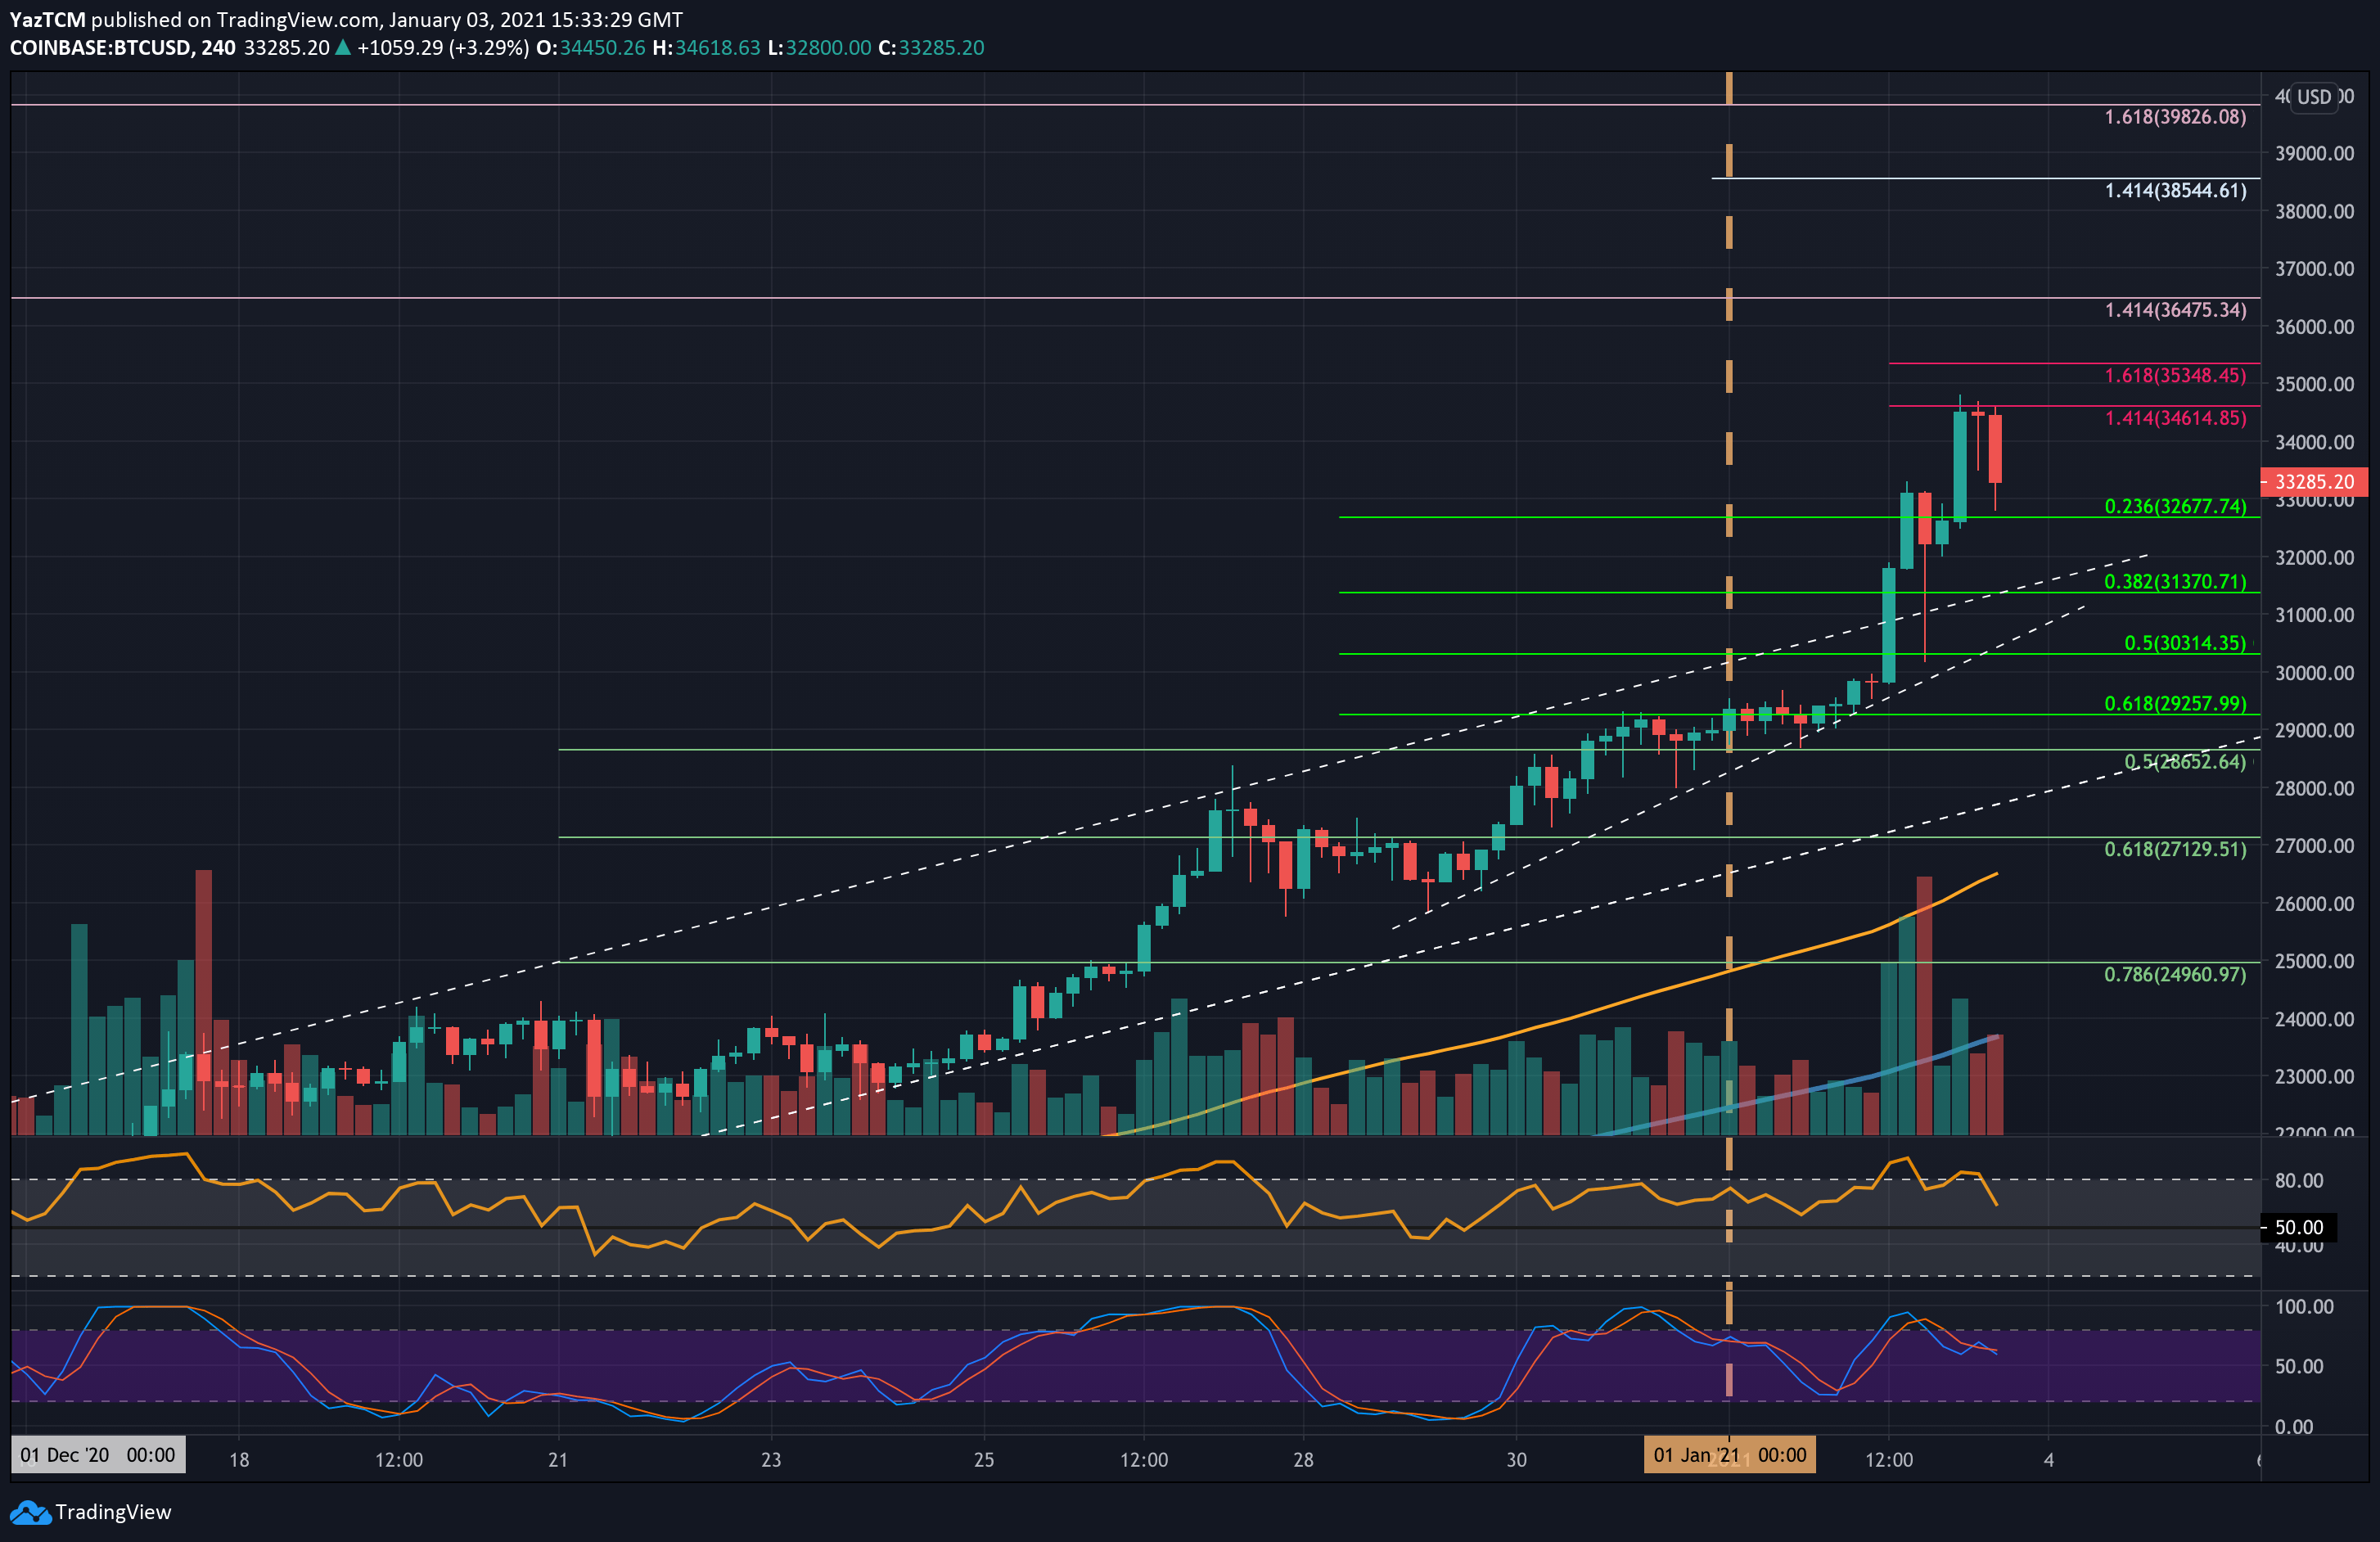
Despite the excitement, the ATH was followed by a quick retracement, as BTC wasn’t able to close the 4-hour candle above resistance at $34,615 – provided by a short term 1.414 Fib Extension level.
As a result, Bitcoin corrected sharply to $32,700 (Bitstamp), dropping precisely into support at $32,680 (short term .236 Fib Retracement). It has since rebounded to trade at $33,350.
The total crypto market cap now sits at $881.9 billion, with Bitcoin dominance at 70%, decreasing from yesterday’s high.
BTC Price Support and Resistance Levels to Watch
Key Support Levels: $32,700, $32,000, $31,400, $31,000.
Key Resistance Levels: $34,000, $34,615, $34,800 – $35,000, $35,350.
As of now, the first major level of resistance lies at $34,000. This is followed by resistance at $34,142 (1.272 Fib Extension). Further above lies $34,615 (short term 1.414 Fib Extension – purple), and the current ATH at $34,800 – $35,000. Next is the $35,350 resistance (short term 1.618 Fib Extension -purple) and $36K.
On the other side, if a correction occurs, we can expect the first support beyond $33K to be $32,700 (the low from past hours, also a .236 Fib level). Further below lies $32,000, as well as the upper boundary of the marked ascending channel on the following daily chart, $31,370 (.382 Fib), $31,000, and $30,315 (.5 Fib).
The daily RSI signals a possible cool-off. The indicator is recording its highest level since July 2020 and has only been this overbought twice throughout 2020. Furthermore, the 4-hour RSI hints of bearish divergence for the first time since mid-December, which could indicate an imminent short-term retracement. Despite the above, the market is very volatile, and the BTC parabolic bullish move is ongoing until proved else.
Coinbase BTC/USD Daily Chart
Coinbase BTC/USD 4HR Chart