Bitcoin Price Analysis: BTC Recovers to $20K, Was Local Bottom Confirmed?
Bitcoin’s price is currently testing the 2017 all-time high range between $17K and $20K and is constantly shadowing lower prices, indicating excess pressure from sellers.
Yesterday BTC recorded a new 18-month low of $17.6K and quickly recovered to $20K in the following hours. However, the downtrend momentum shows no indications of weakening, yet, making it difficult to predict a local bottom at this time.
Technical Analysis
Technical Analysis By Shayan
The Daily Chart
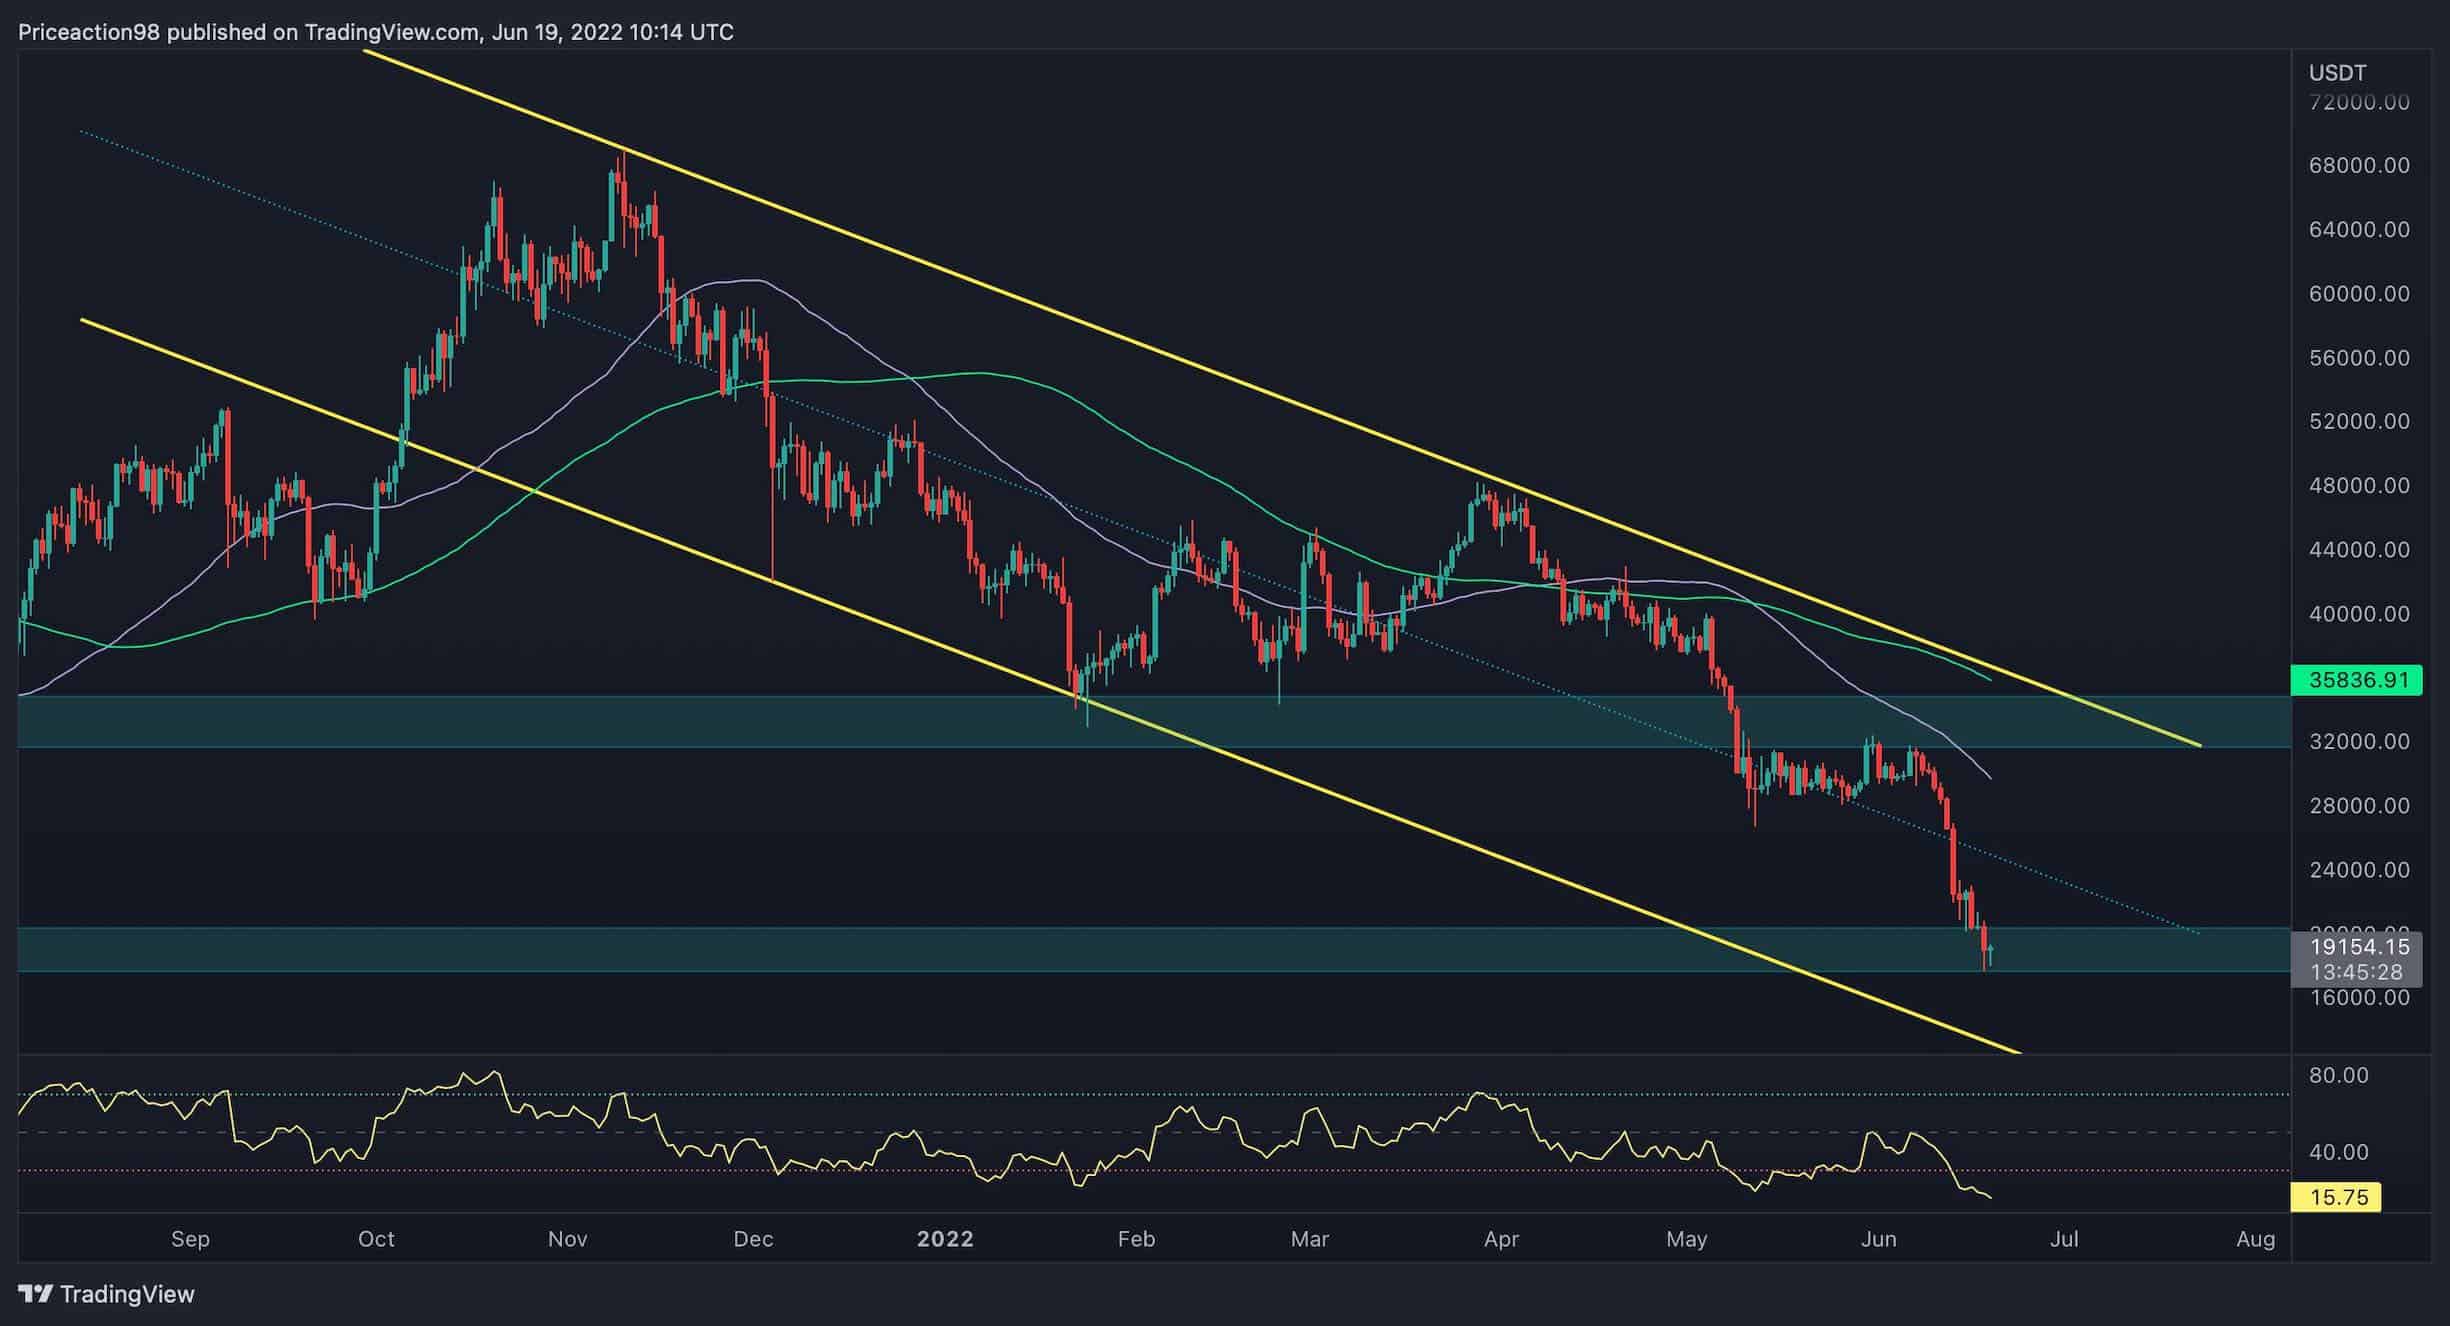
As mentioned above, Bitcoin’s price ranges at the significant support level of $17-20K, which also contains 2017’s all-time high.
The good news is that a pullback to one of many existing resistance levels is likely anticipated based on the market sentiment and a divergence between the price and the RSI indicator. As seen below, the 50-day moving average line and the channel’s mid-trendline are the main barriers on the way up.
Nevertheless, the price would still need to break above the $32K level and the 50-day and 100-day moving averages to start considering a bullish reversal.
The 4-Hour Chart
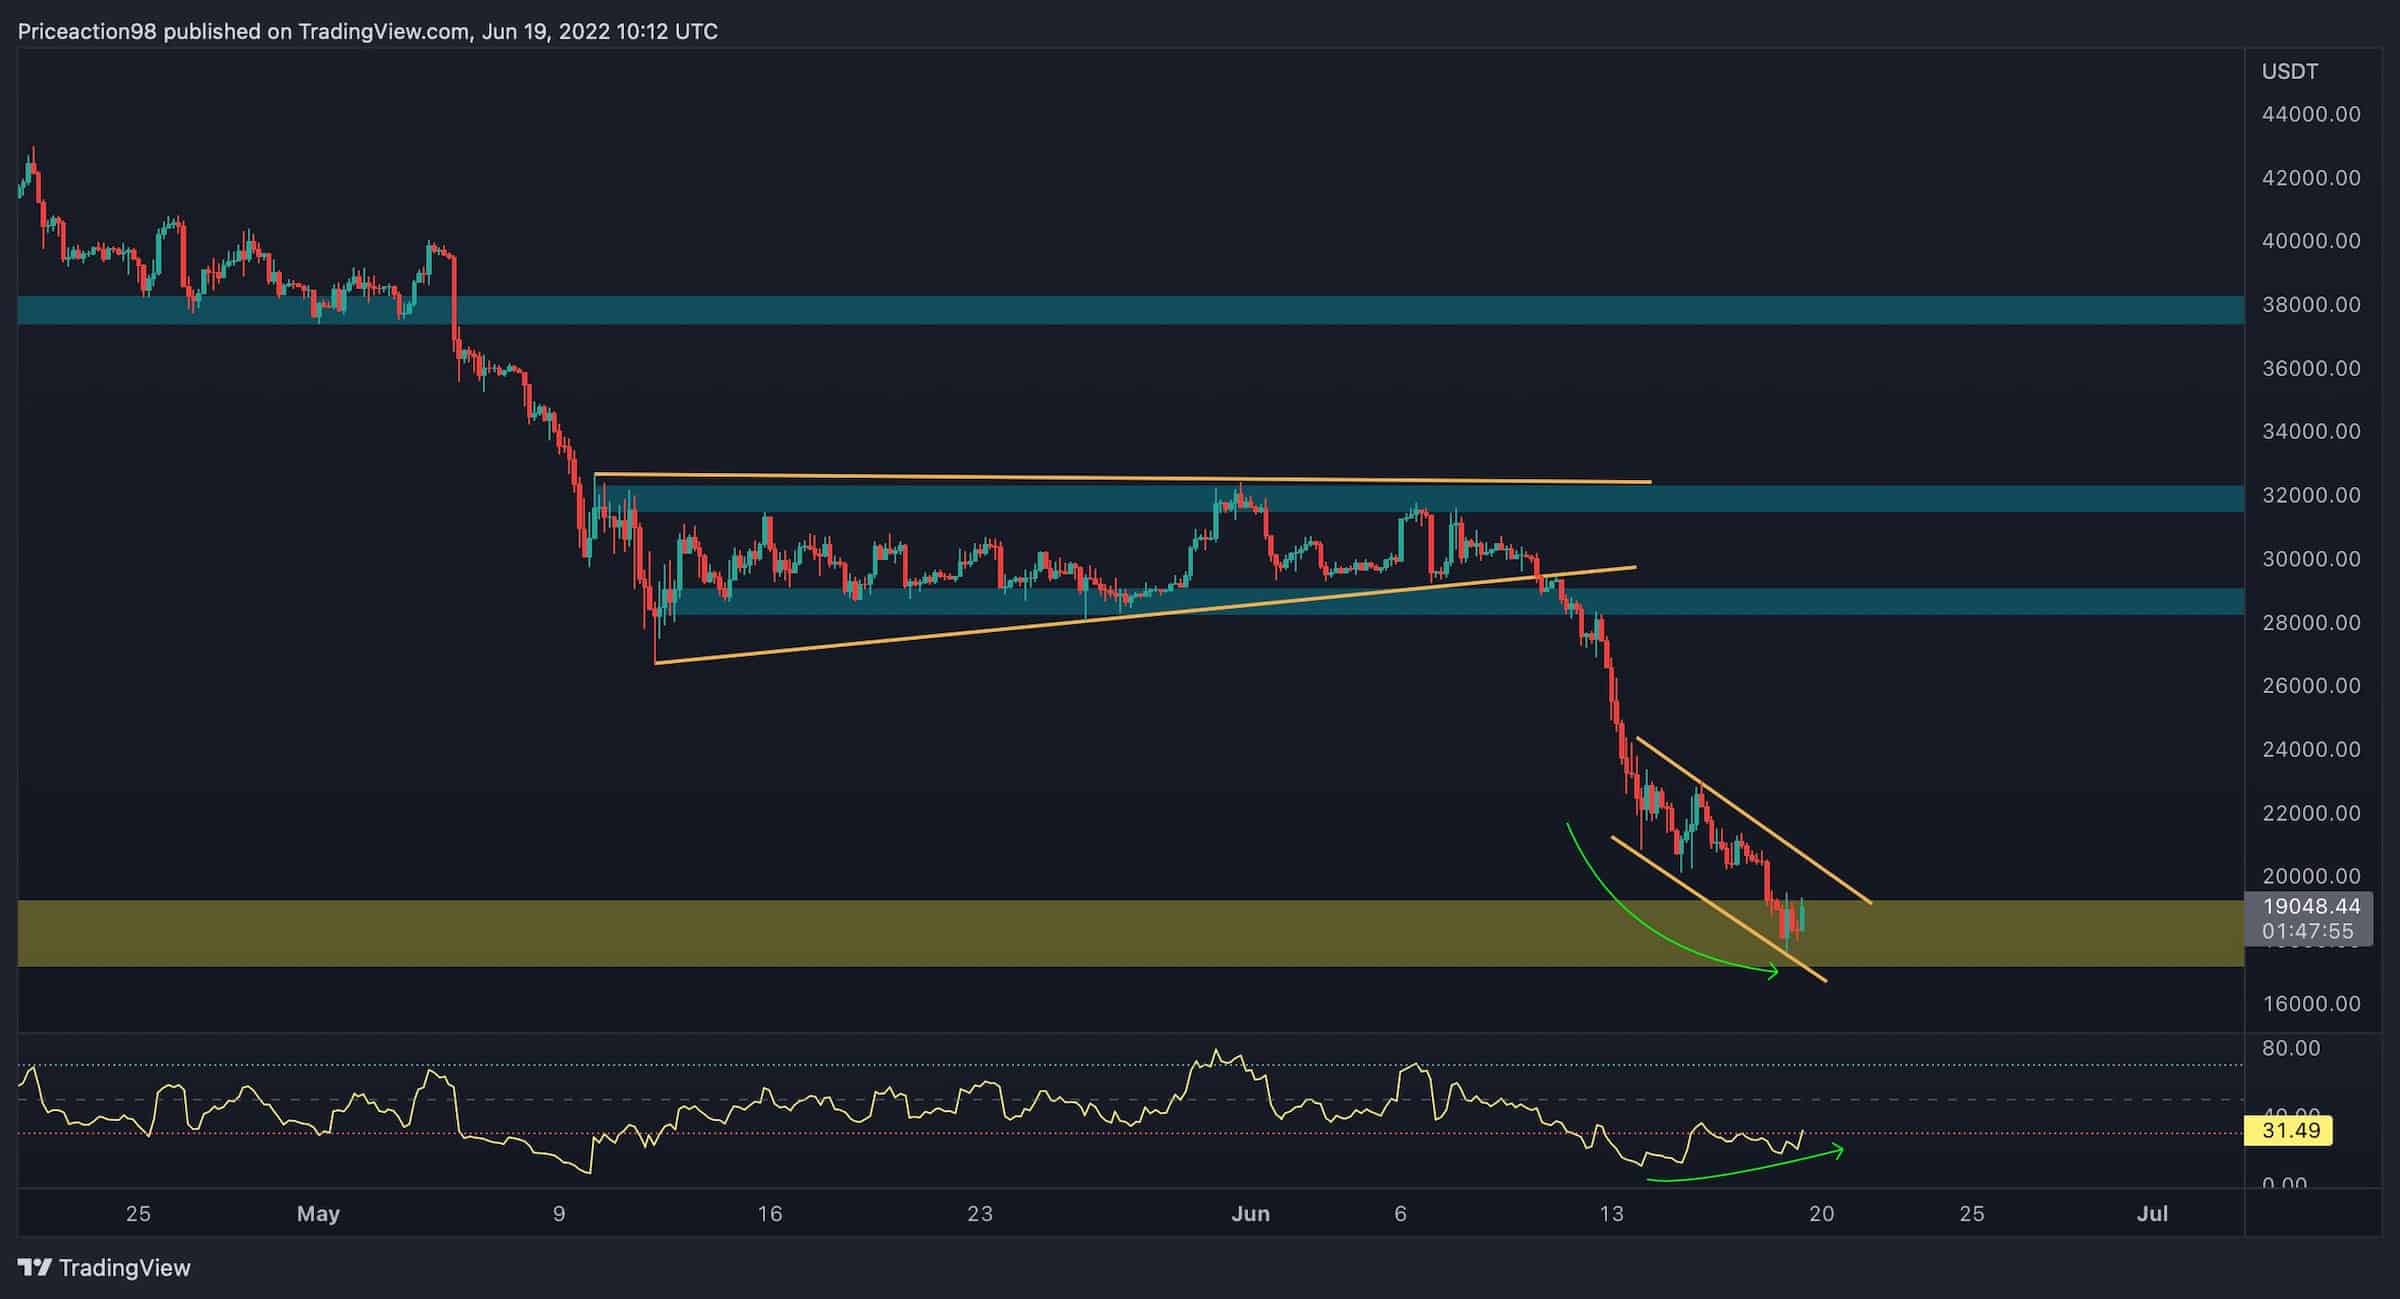
After a boring mid-term consolidation, the price has entered an expansion phase and experienced a steep drop to the $17K crucial support level.
The chart below shows a descending channel pattern at the $17K – $20K support region. This is a bullish reversal pattern, and if the price bounces off the third touch of the lower boundary and breaks the pattern to the upside, a short-term rally will likely be initiated.
Considering the divergence between the price and the RSI metric in the 4-hour timeframe and the mentioned descending channel, a short-term rebound towards the $24K level and even the $30K supply zone could become probable.

On-chain Analysis
On-chain Analysis By Edris
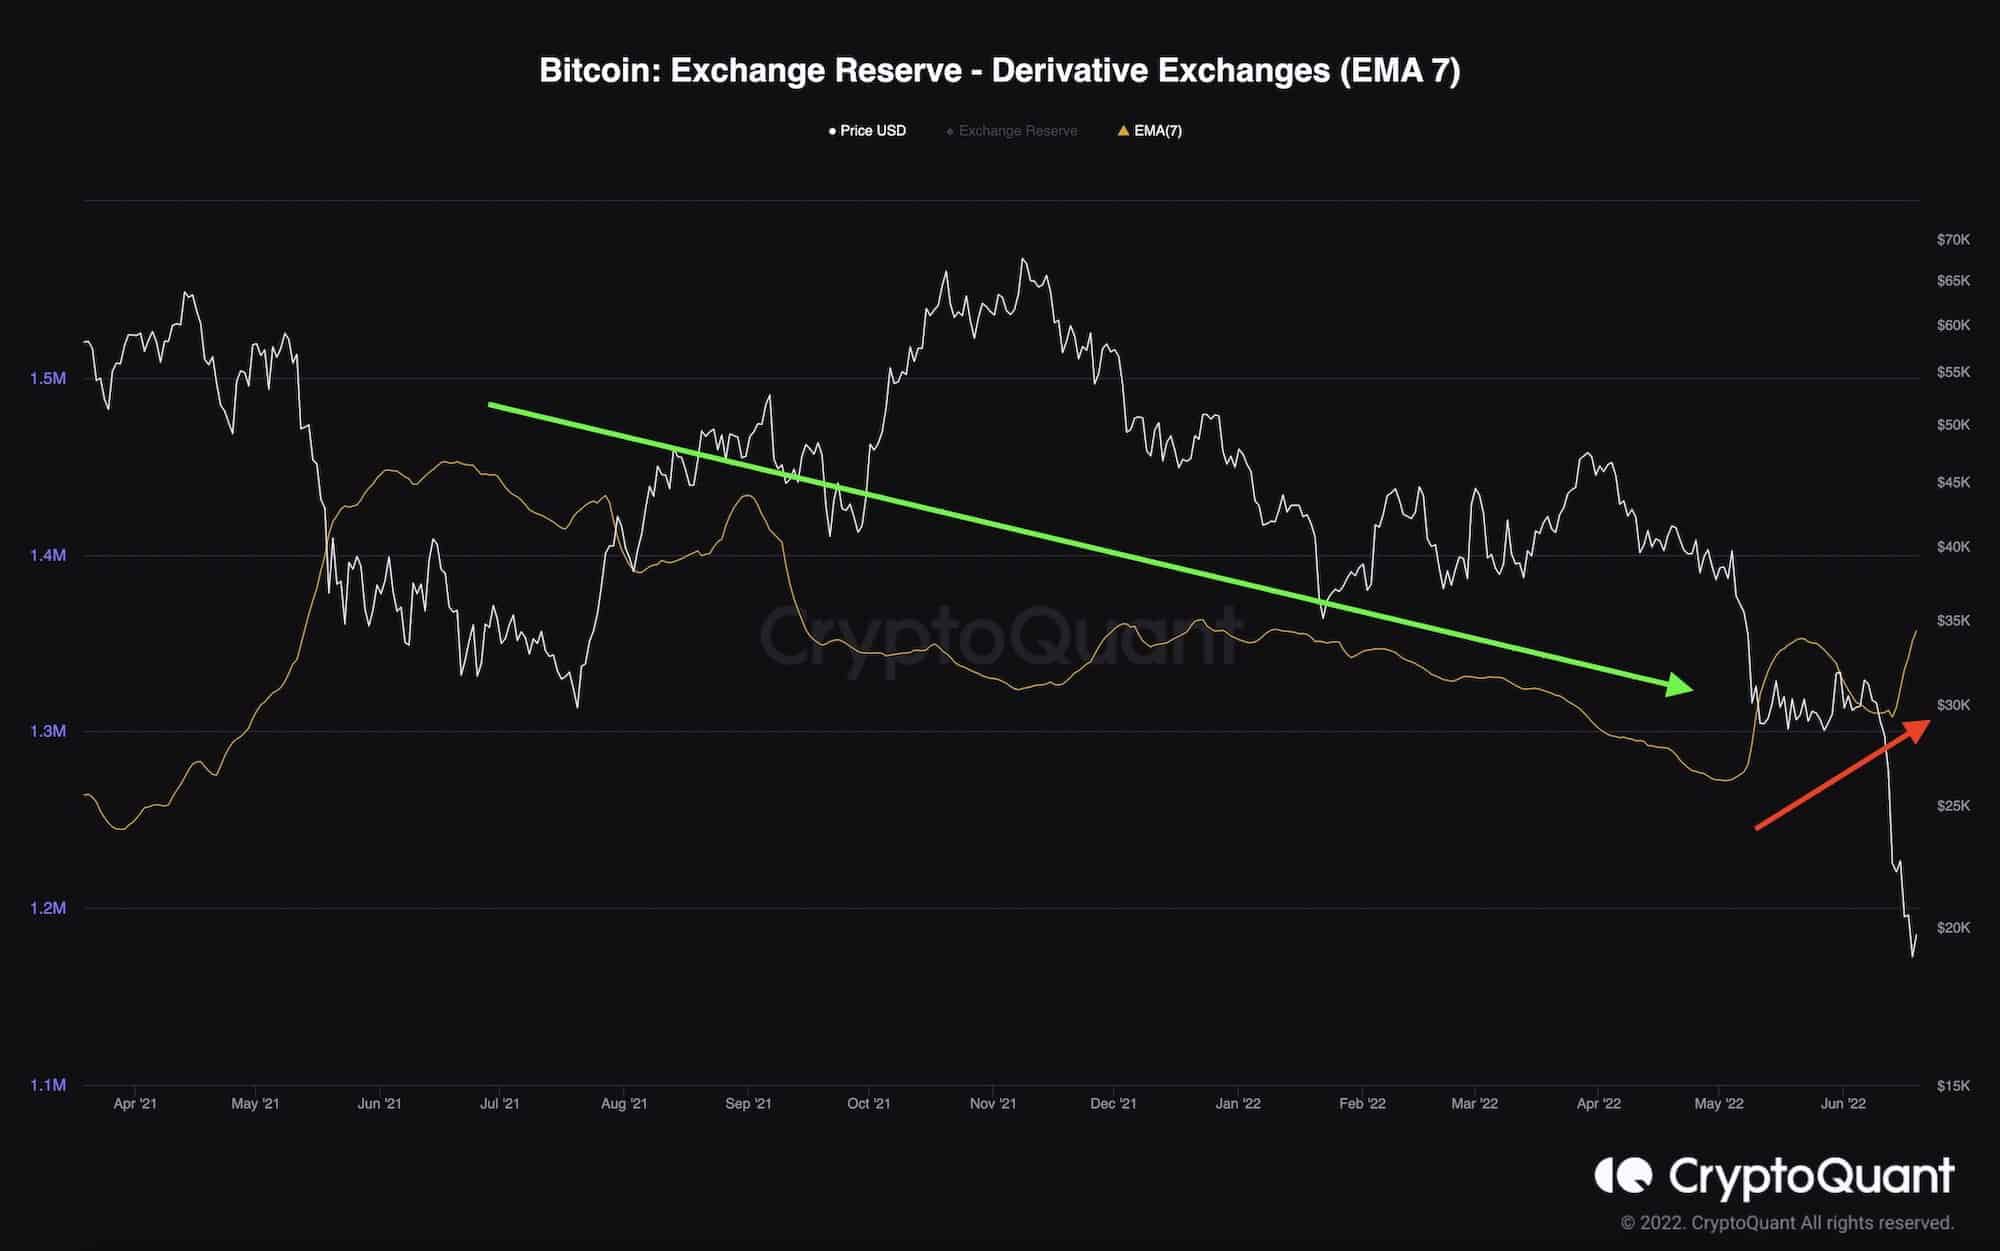
Bitcoin: Exchange Reserve – Derivative Exchanges
Bitcoin’s price has been crashing so rapidly that the long-term holders and even some whales are reacting by deploying their assets into exchanges, opening leveraged short positions and lowering their risk by hedging against possible further price declines.
The long-term holders and whales often use this strategy to survive the bear markets without selling their coins on the spot markets. However, this aggressive shorting would create even more selling pressure and further lower prices.
On the other hand, it would also create a possibility for a massive short-squeeze if sufficient demand comes in and the price suddenly reverses to the upside.
The potential short liquidations and profit-taking, which would usually occur at market bottoms and capitulation, would cause a rapid surge in price and could even start a new mid-term bullish phase. Although, with Bitcoin’s recent heavy price action, it may take some time and even more pain before the final capitulation candle can take place.


