Bitcoin Price Analysis: BTC Reclaims Critical Level Following a Strong Weekly Close, Here Are Next Targets
September was a volatile month full of liquidation events, FUD, global risk-off, uncertainty over monetary policy, and a rising dollar. Yet, Bitcoin managed to hold the larger technical structure at $40k while maintaining the bullish trend in on-chain metrics.
BTC has shown tremendous strength in the past week by closing back above the rising trend line at $44k, reclaiming $45.2k, the critical 200-day moving average, and printing a bullish engulfing candle. Bitcoin also managed to push back into the green zone between $47.2k to $50.5k, an area which was previous support.
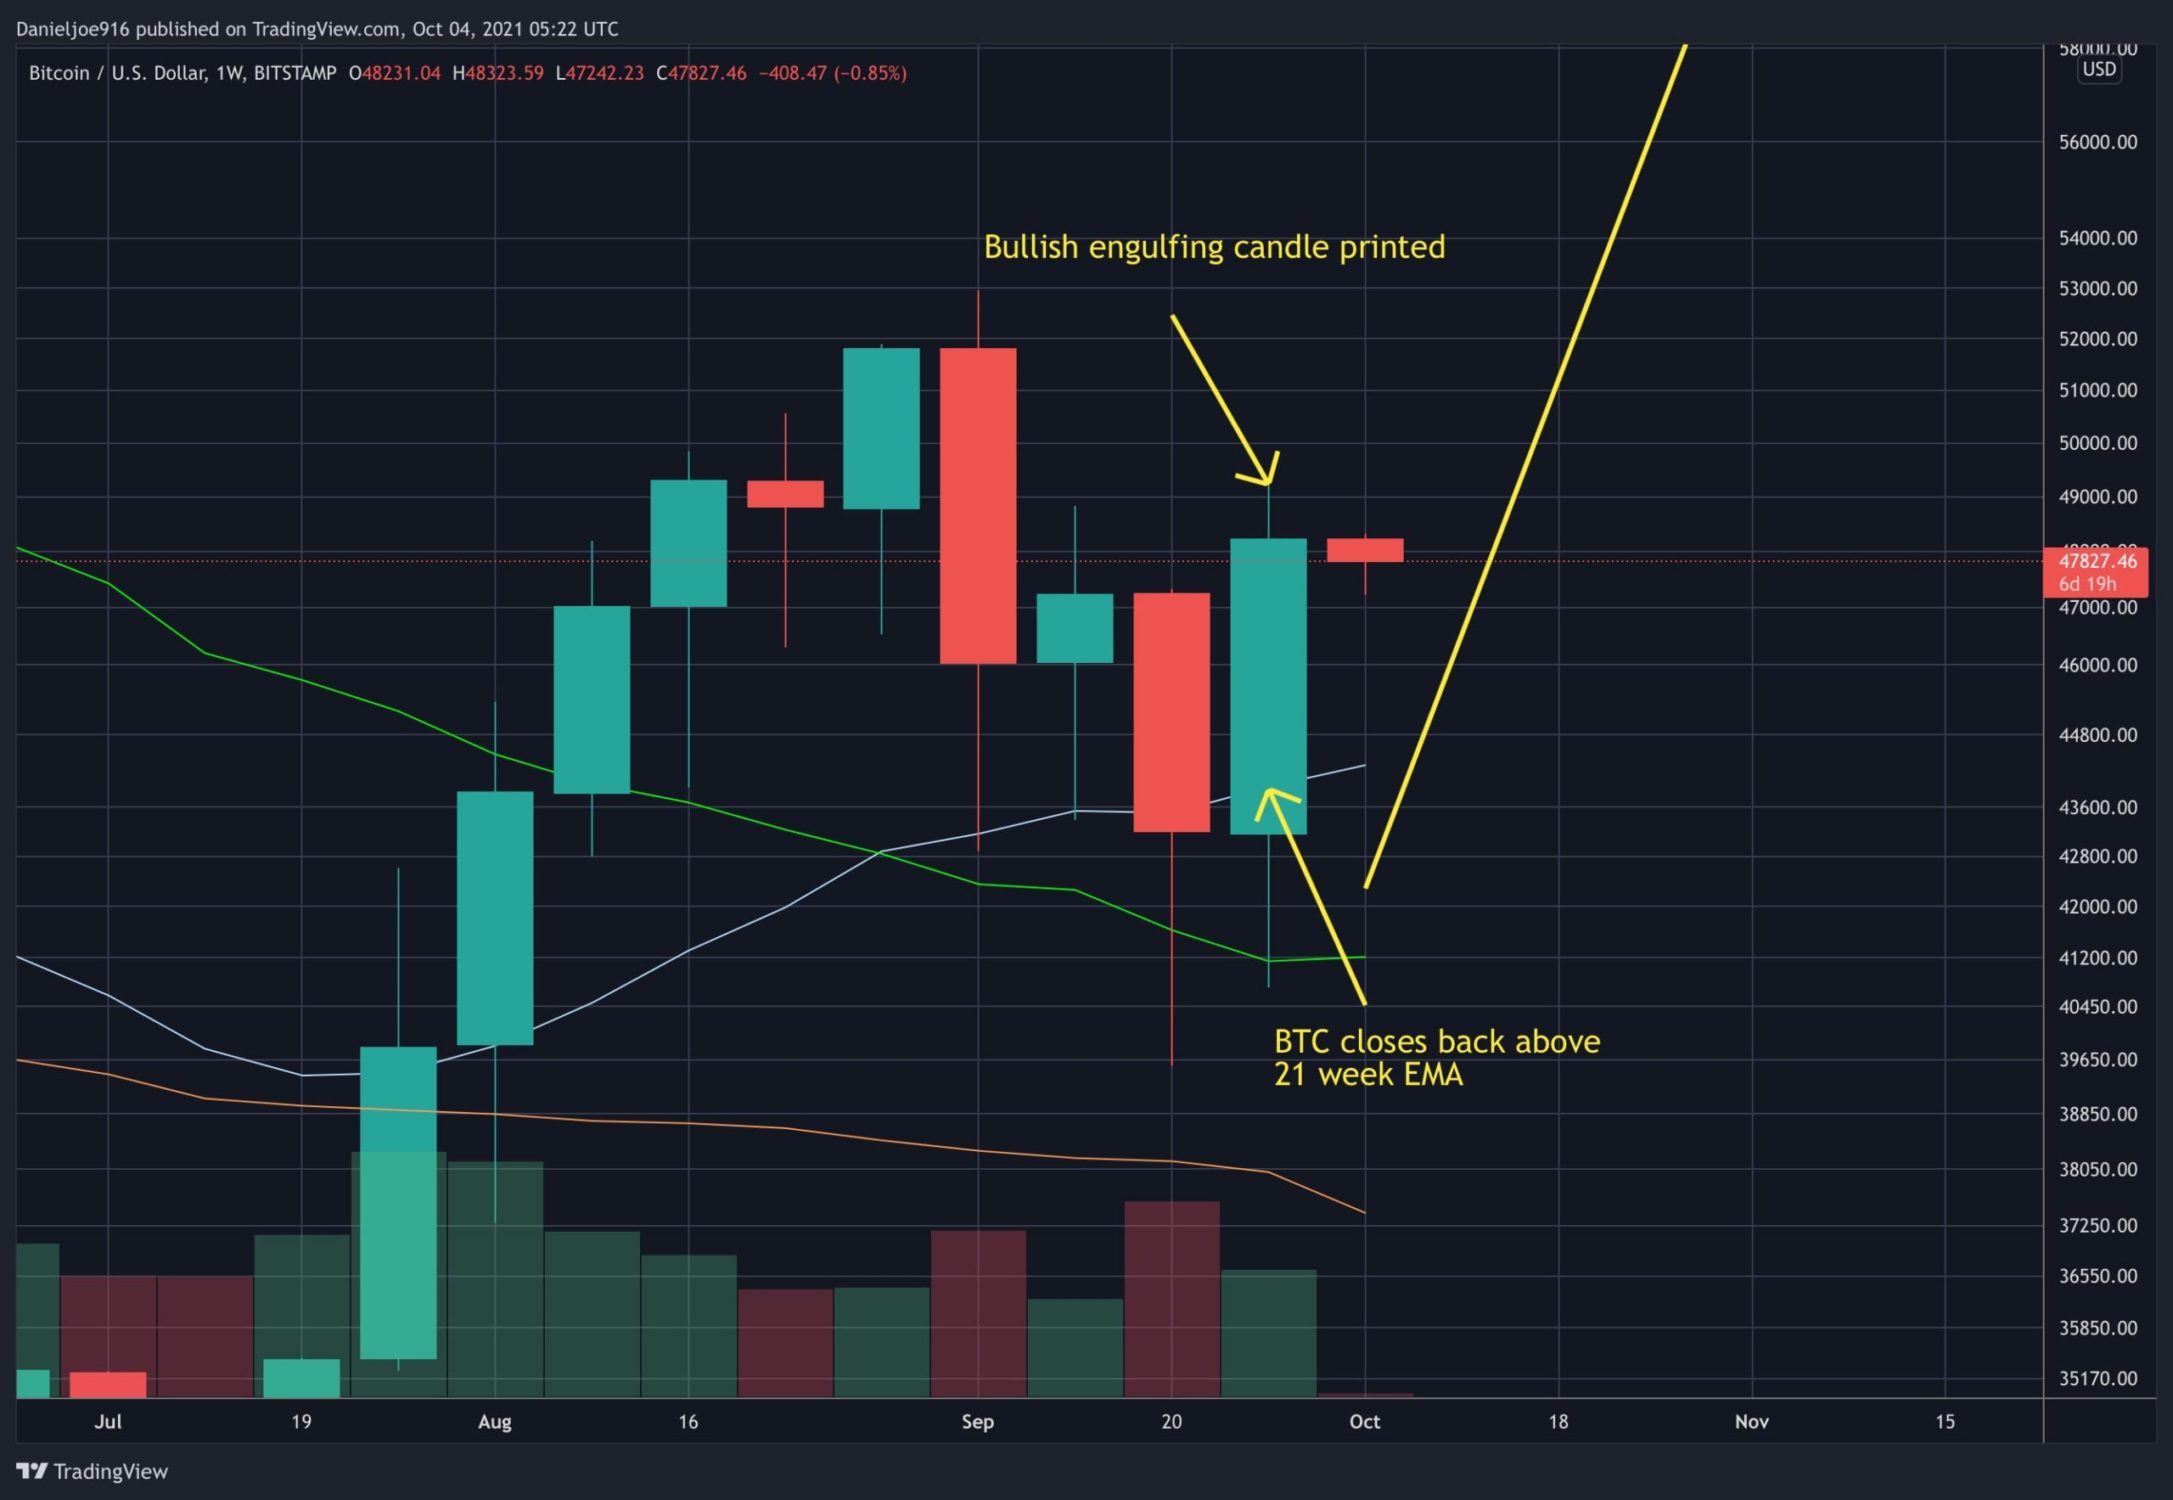
Near-term, it is important for BTC to establish support at $47.2k to $47k, as this level has a large amount of supply according to the UTXO Realized Price Distribution metric. When the price is above this level, it acts as support. So far, BTC has retested $47.2k a few times and managed to hold support.
Elliott Wave Suggests Wave 2 Pullback Nearly Completion
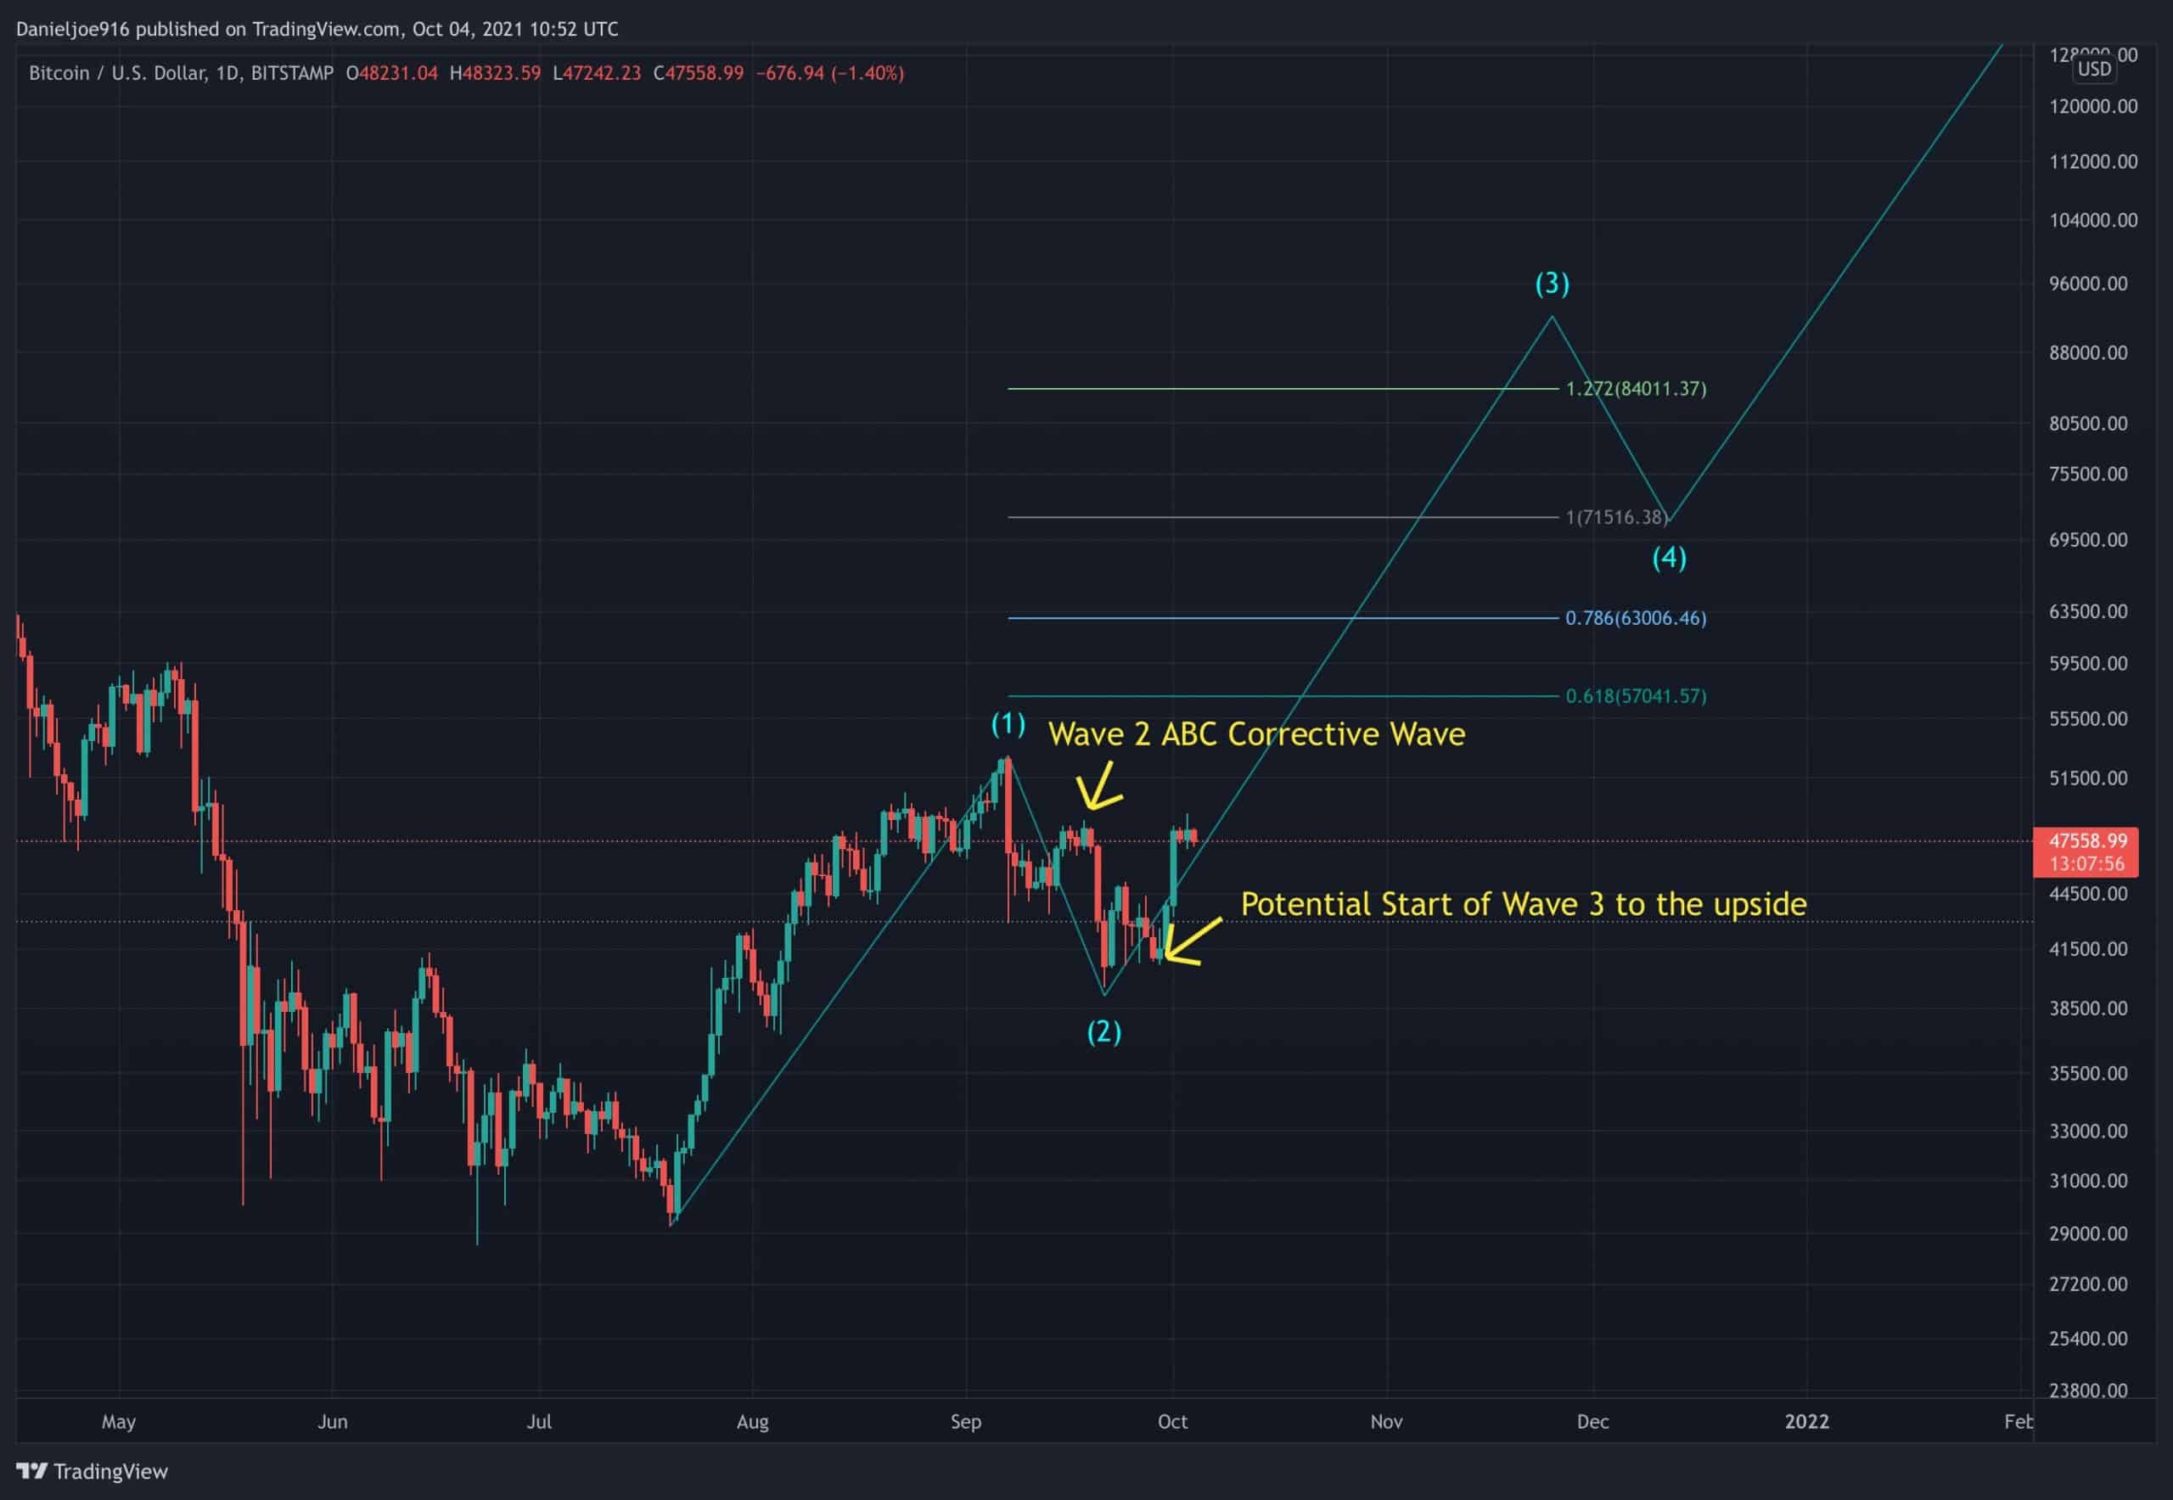
As we covered recently, the pullback from $52.9k to $39.5k followed a 3 wave ABC corrective wave down, typical during pullbacks after a five-wave impulse higher. The bottoming process took some time as global stocks went risk-off, but BTC showed strength by holding the deepest higher low at $40.7k for an entire week before pushing higher.
The recent close above $45.2k further suggests BTC is currently in sub-wave 3 to the upside, part of the following five wave impulse higher. Near term, the bulls need to protect $47.2k as support and start pushing BTC above $48.8k, a near term lower high and most importantly above $52.9k, the high from September. To confirm the pullback to $39.5k was a bear trap, we need to see the BTC price close above $52.9k for validation.
The larger wave structure suggests the pullback from $64.8k to $30k was a larger Wave 4 correction after a powerful Wave 3 higher, sending BTC from $3.8k to $64.8k. Using this wave count, BTC appears to be in the early phase of larger Wave 5 to the upside, potentially sending BTC to new all-time highs.
On-chain Trend Firmly Bullish
While Bitcoin corrected and consolidated in the low $40k area with very bearish sentiment, on-chain metrics continued to show that long-term holders firmly held while leverage on derivatives and weak hands were flushed out.
Even as BTC corrected for multiple weeks, spot exchange reserves have declined by over 14,000 BTC showing strong accumulation. Spot exchange reserves have been trending lower since July 26th, 2021 as BTC continues to be scooped up and withdrawn from exchanges. This is a very bullish signal as the cryptocurrency is becoming scarcer in liquid form, making it more difficult for large institutions to accumulate it without moving prices higher.
CryptoQuant’s Mean Coin Age metric which measures the trend of accumulation or distribution in long-term holders, continues to trend higher, showing strong accumulation, indicative of bull market continuation. The current conditions look very similar to the 2013 mid-cycle pullback where BTC consolidated for six months while the mean coinage continued to trend higher as long-term holders re-accumulated.
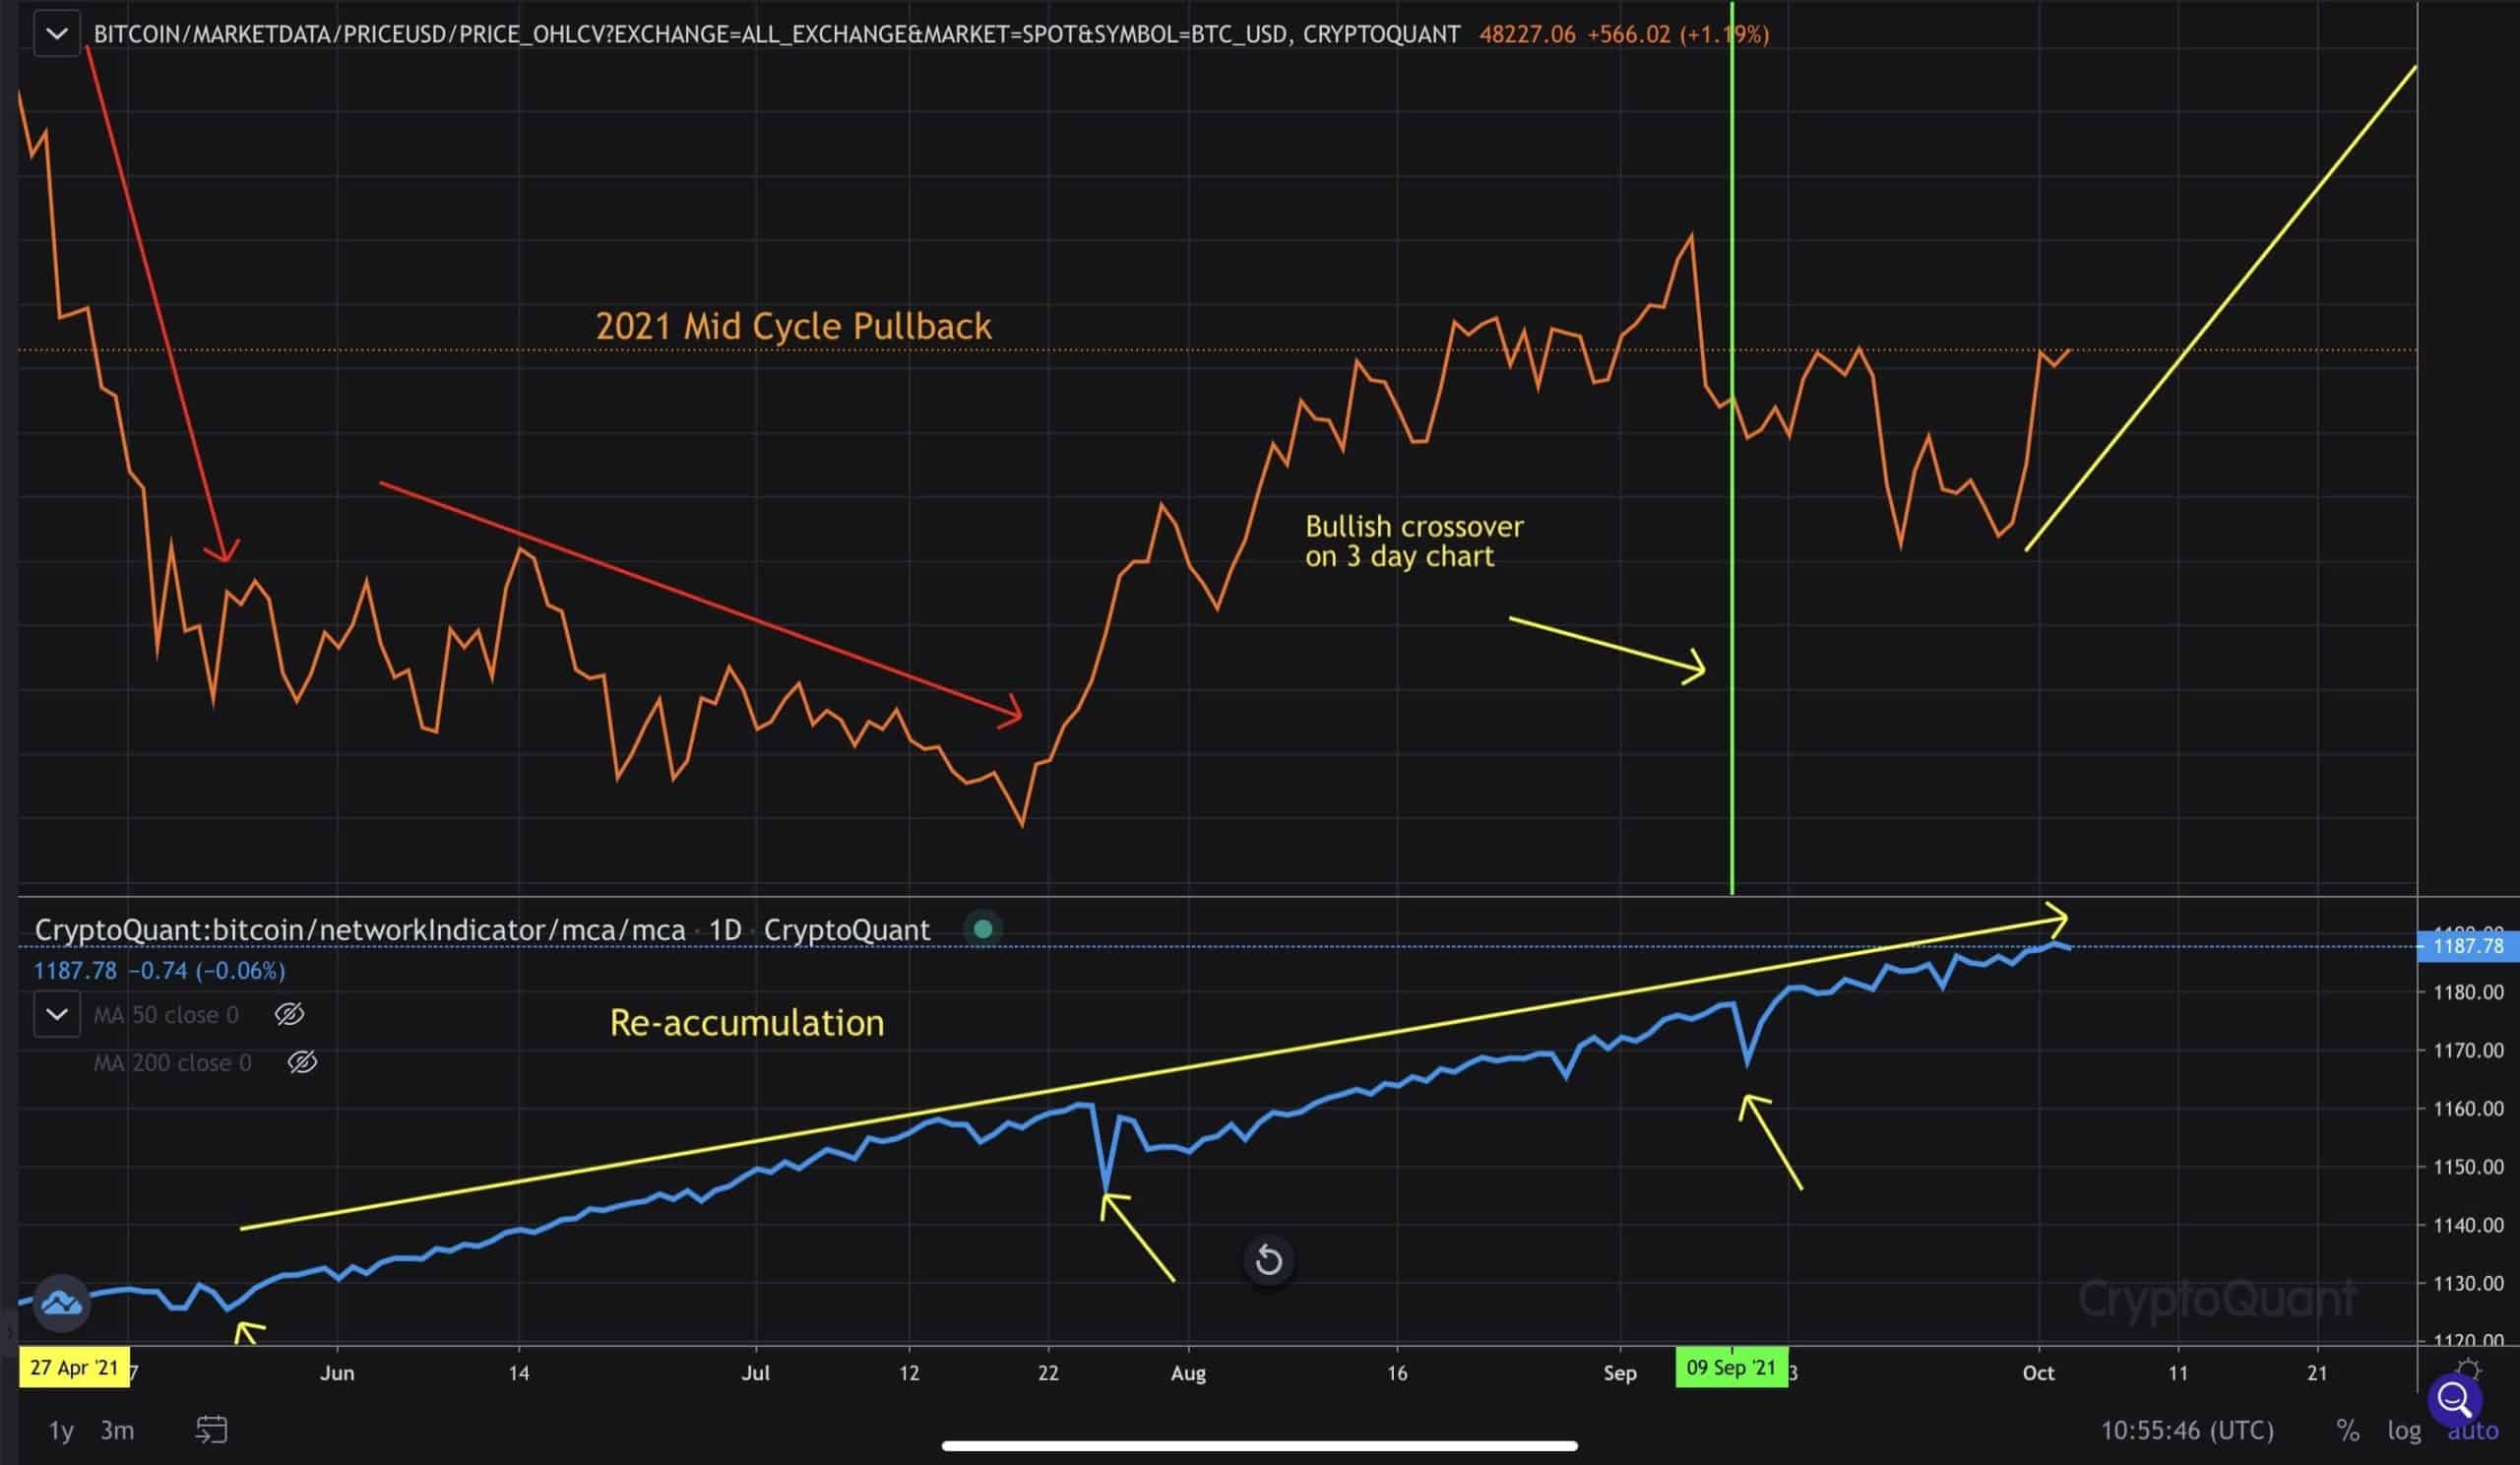
This period of consolidation led to the second half of the bull market where BTC made new all-time highs and went parabolic. This, of course led long-term holders and miners to distribute, causing the mean coin age to trend lower, confirming a trend of distribution. The current conditions show no signs of long-term holders distributing, which indicates the second half of the 2021 bull market is just beginning.
Miner reserves have remained flat to slightly higher for the year indicating that miners show no interest in selling large amounts of Bitcoin even with wild swings caused by liquidations and FUD. Although miners recently sold a small amount of BTC relative to total holdings, it is nowhere close to the aggressive selling we saw during bear markets which are when miners come under extreme pressure to mine profitably. Additionally, the Bitcoin hash rate has more than tripled since the June lows, signaling miners are plugging back into the network after the migration out of China.
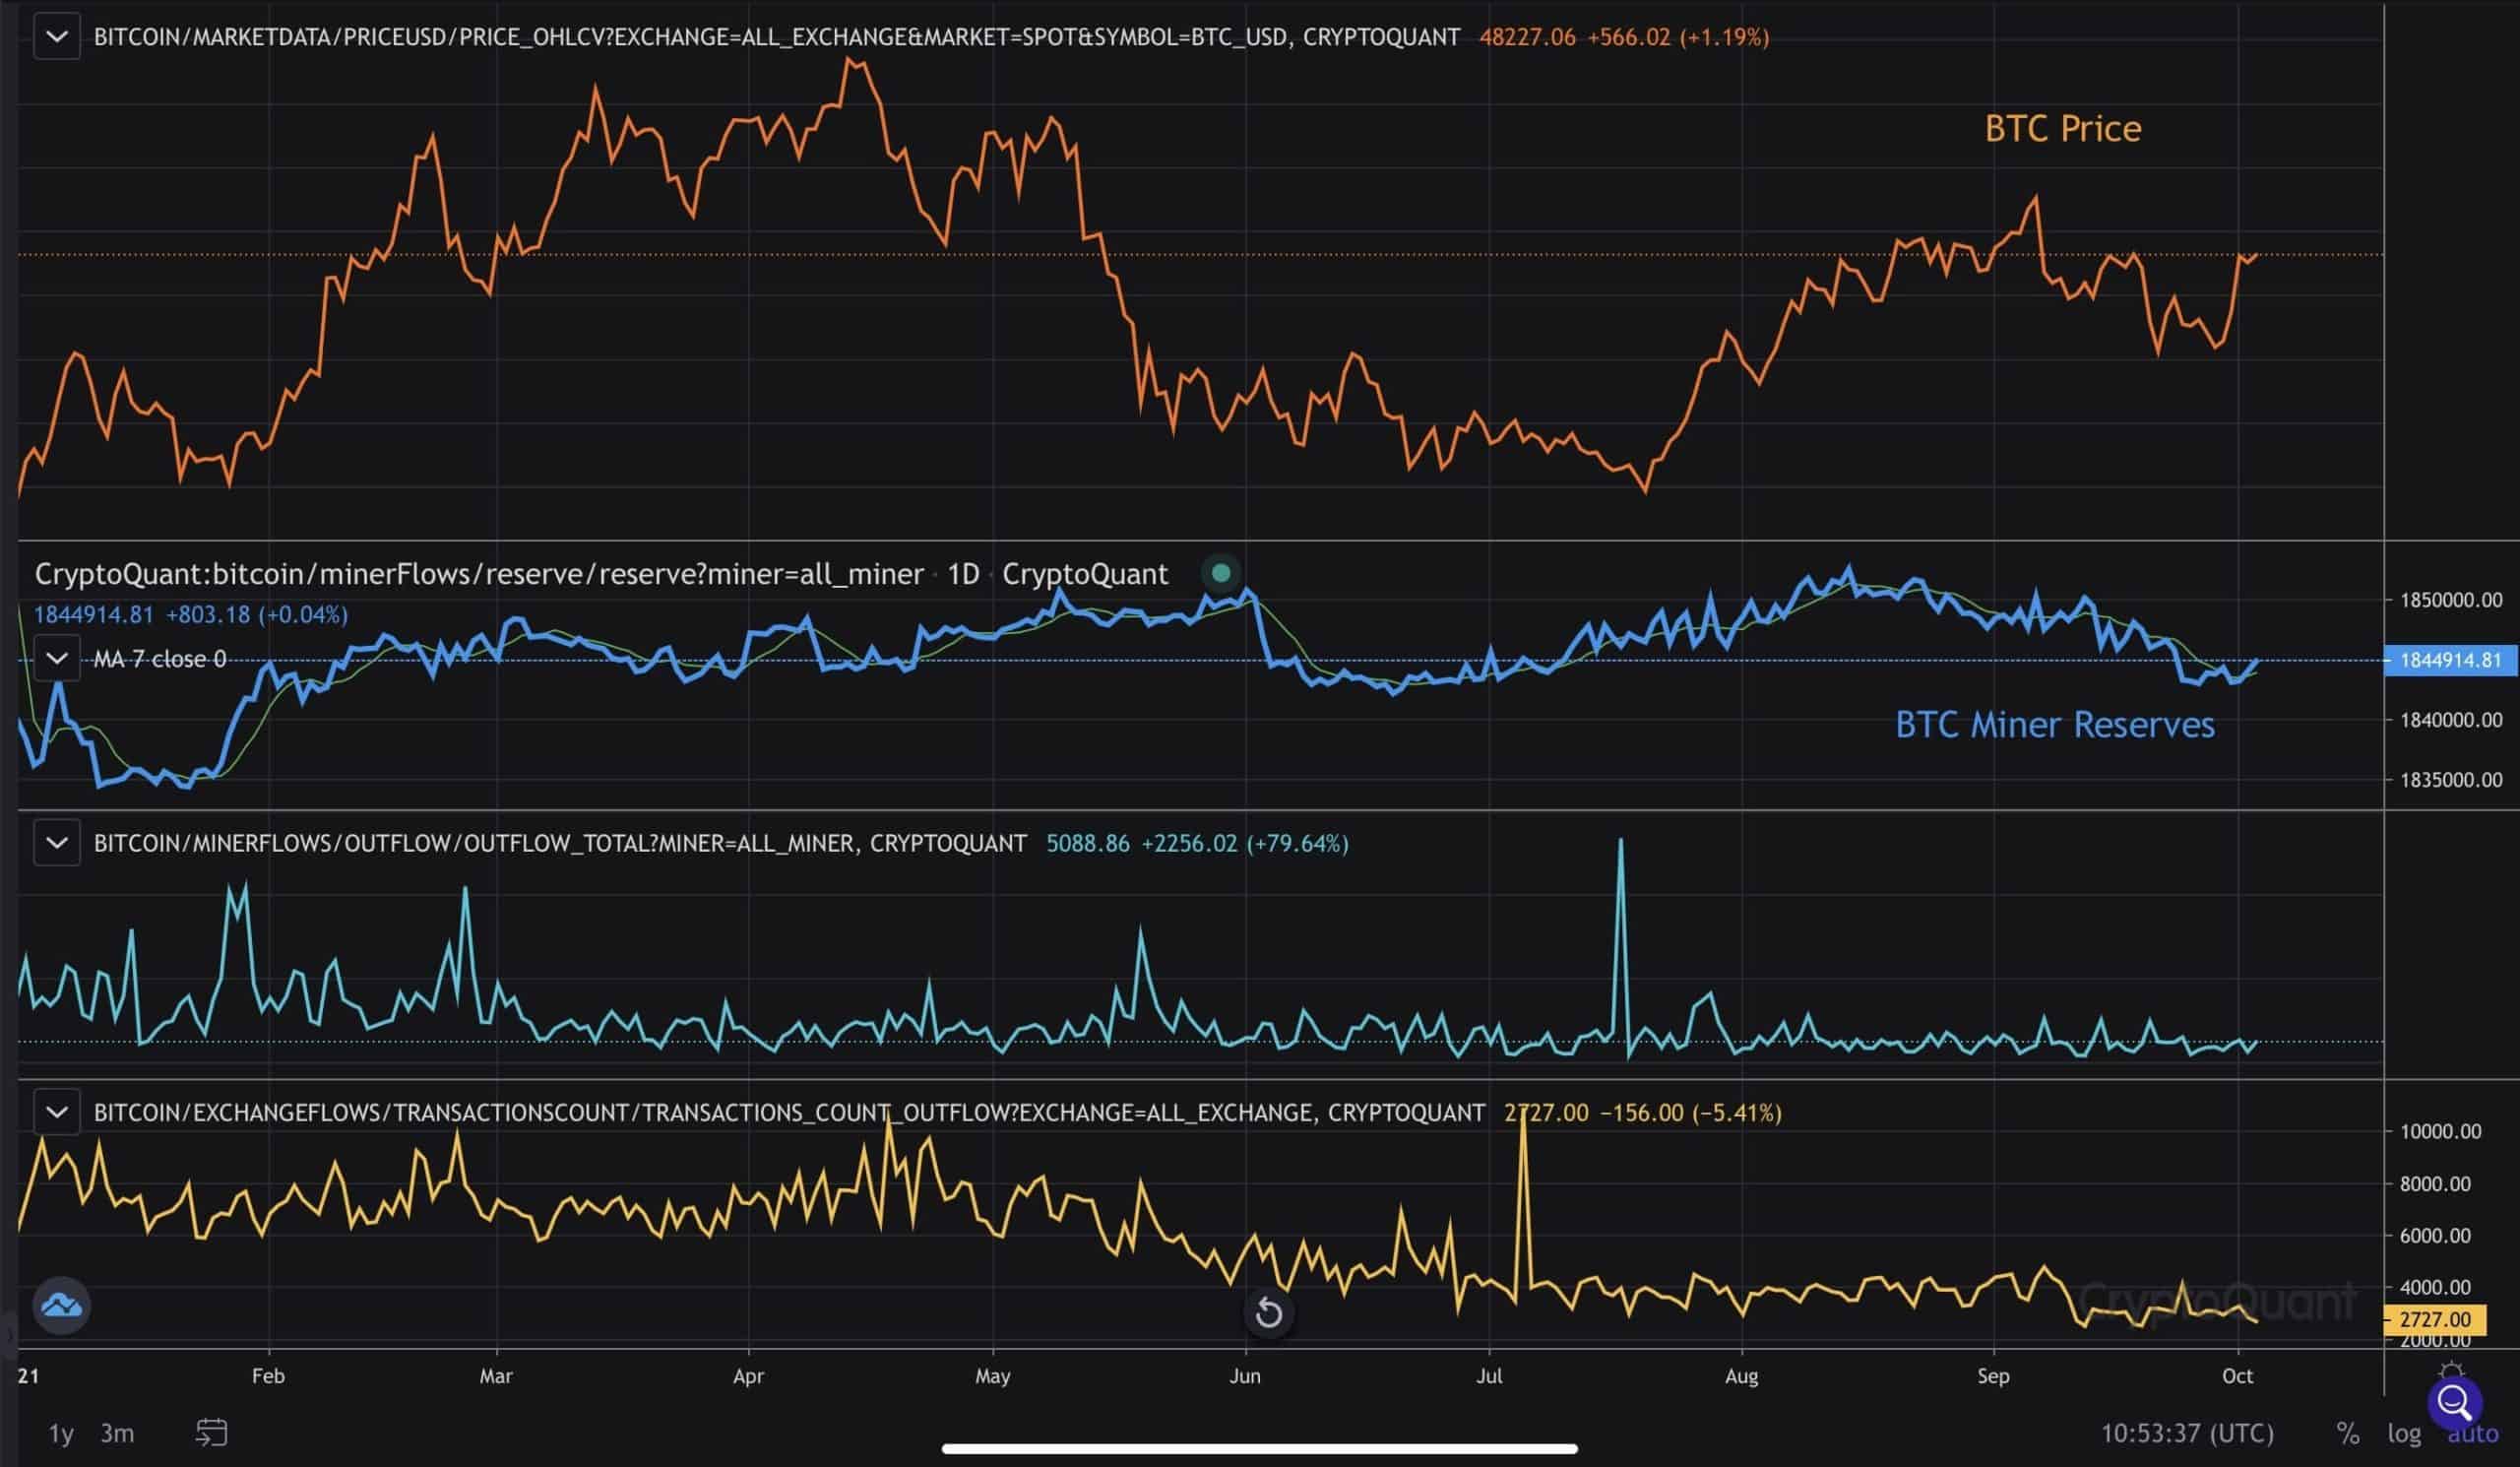
With current Bitcoin prices, overall miners are highly profitable, which incentivizes them to HODL instead of selling to cover operational costs. This is quite notable because the new supply of Bitcoin coming onto the market is mostly being held by miners. The majority of the existing supply of Bitcoin continues to be held by long-term holders and entities with little to no selling history, which further shows supply is increasingly becoming more scarce.
Risk On Trade Resuming?
With a new week, market participants will be watching stocks and the dollar closely to see if risk-on will return to the market. The dollar appears to have topped out recently, while the SPX formed a double bottom managing to hold the intraweek lows from over 2 weeks ago. With macro conditions continuing to favor risk assets such as rates at zero, trillions in liquidity, plenty of fear in the market, and no signs of euphoria when stocks made new all-time highs weeks ago, it’s starting to look more likely the risk-on trade could resume in the coming weeks.
With Bitcoin outperforming stocks lately, a return could be a major tailwind for further upside. With a strong trend in fundamentals, technicals, and on-chain metrics, the cryptocurrency looks positioned for significant upside later this year. The bulls are slowly gaining control.


