Bitcoin Price Analysis: BTC Rebounded At Key Support, Is The Bottom In?
Bitcoin’s price rally slowed down after getting rejected at the 200-day moving average line amid the $48K range.
The 1-Day Timeframe
Technical Analysis by Edris
The price dropped lower since the MA200 rejection and is currently retesting the 50-day and 100-day moving average lines. These MAs have also printed a bullish cross recently, as the 50-day MA has crossed above the 100-day MA.
The $42K level is currently holding the price, is also a significant horizontal support level. This level was a resistance turned into support after a bullish breakout a few weeks ago.
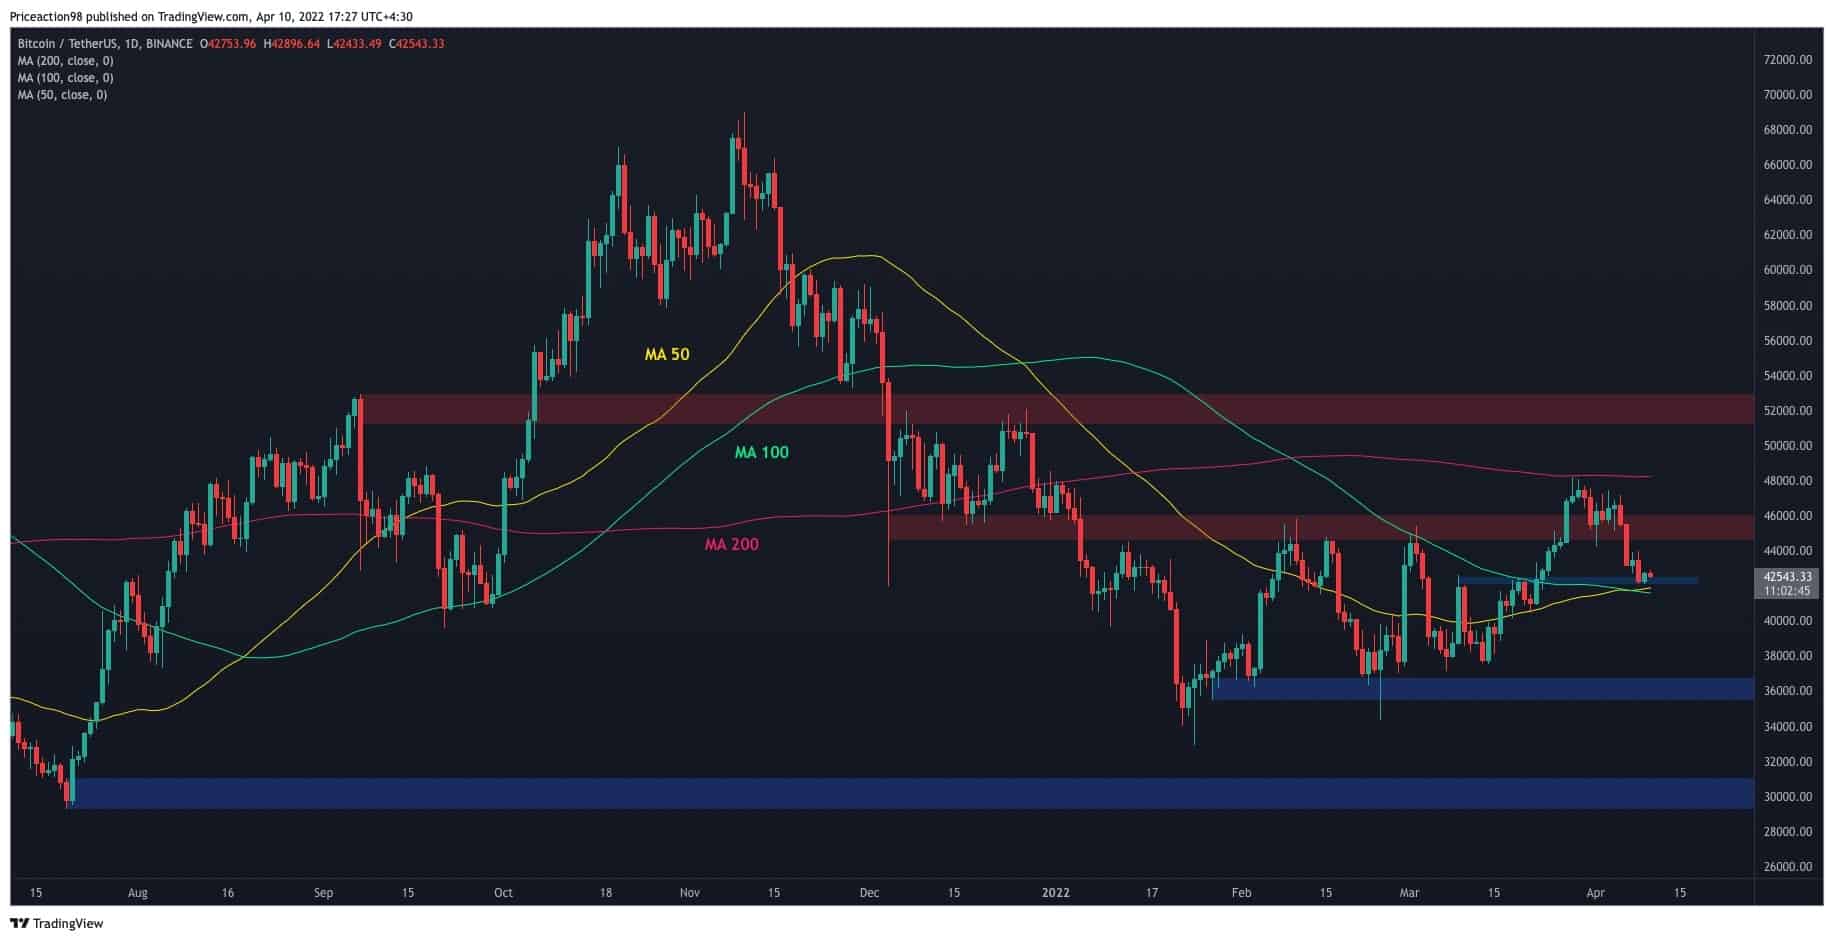
However, if this area fails to hold the price, a retest of the $36K zone would be a likely scenario.
On the other hand, if the price rebounds from this support level, the $48K zone and the 200-day moving average would be likely retested.
The 4-Hour Timeframe
On the 4-hour timeframe, it is evident that after the price has reached the top of the large bearish flag pattern, it has been rejected to the downside and made a lower high and a lower low.
This price action indicates that the bears are now controlling the market, and a new downtrend could be on the horizon.
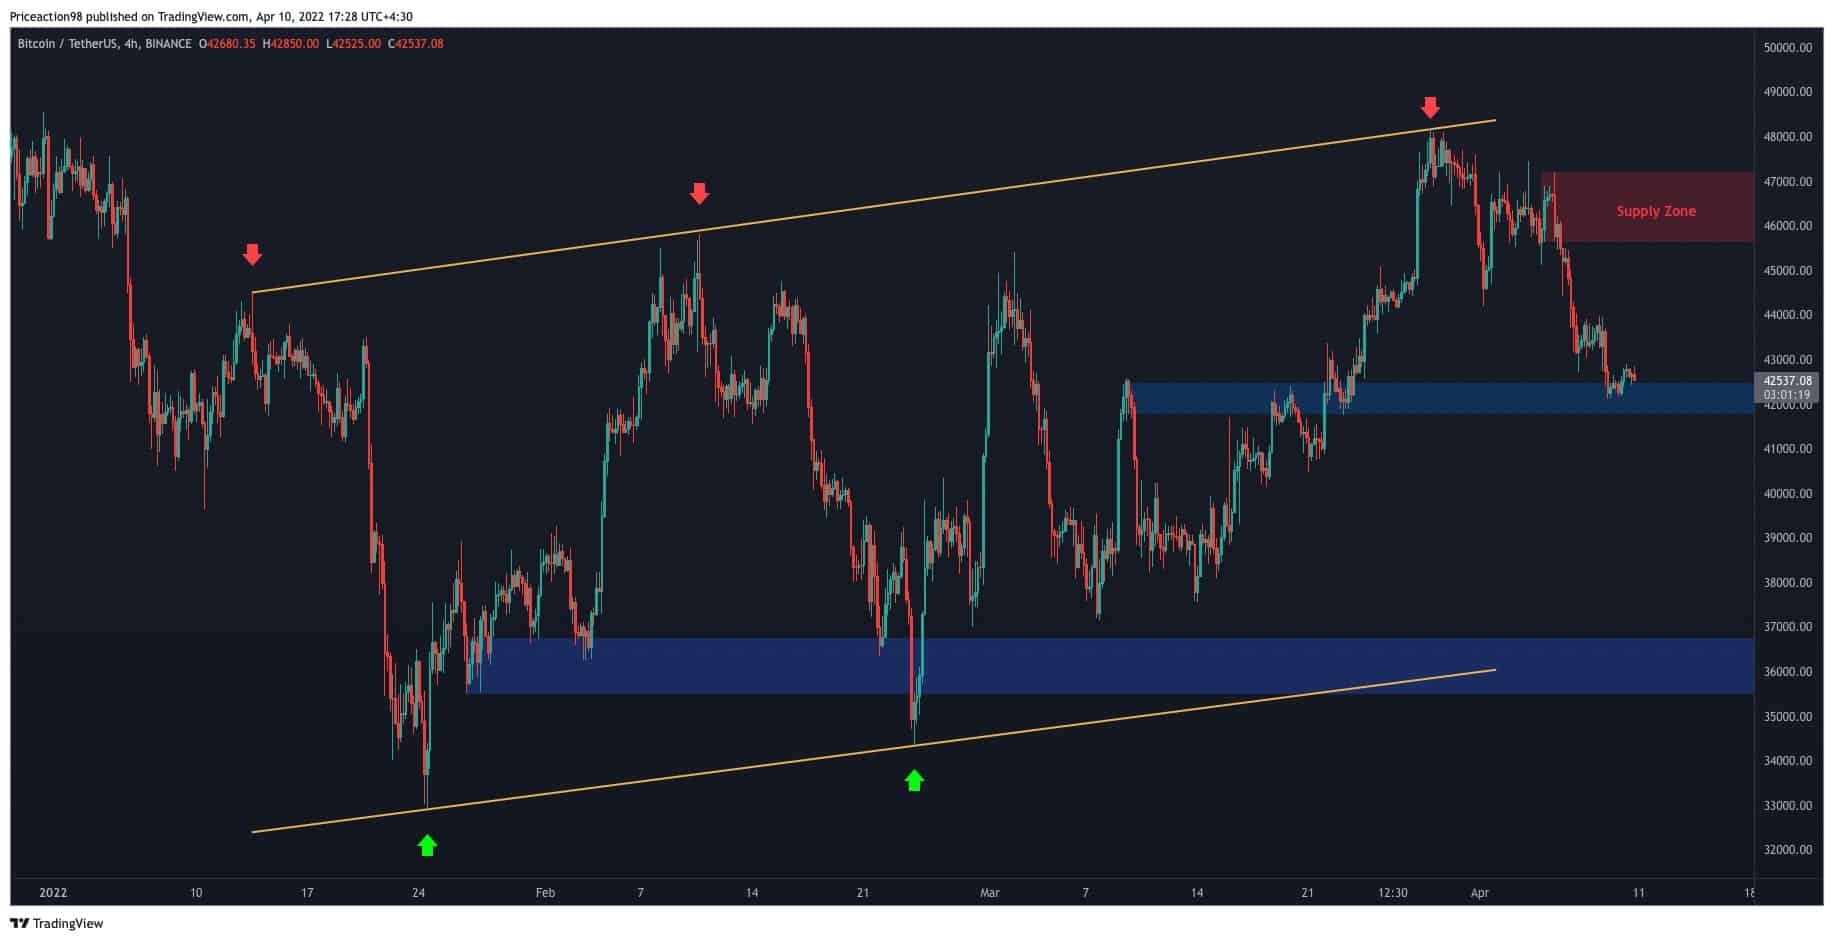
However, the $42K level might serve as solid support. From the bullish side – the critical supply zone remains around the $47K level, which could initiate the next bearish leg and higher low.
In the bearish scenario, if the price loses the $42K support, a retest of the $36K level and the bottom of the bearish flag would be imminent. A bearish breakout from the base of the flag would validate it and form a bearish continuation and probably a new lower low below the $33K bottom – the lowest level for the past months.