Bitcoin Price Analysis: BTC Not Quite Ready to Challenge $60K, Watch This Level First
Following weeks of a downtrend, Bitcoin’s price has seemingly found a bottom. Yet, if the price recovers, one key level should still be reclaimed.
Technical Analysis
By TradingRage
The Daily Chart
On the daily chart, the price has been supported by the $56K support level after breaking below the 200-day moving average, located around the $58K mark.
Yet, the market is once again testing the 200-day moving average from below. If it is successful in rising above it, the $60K resistance level will be the next key zone to penetrate.

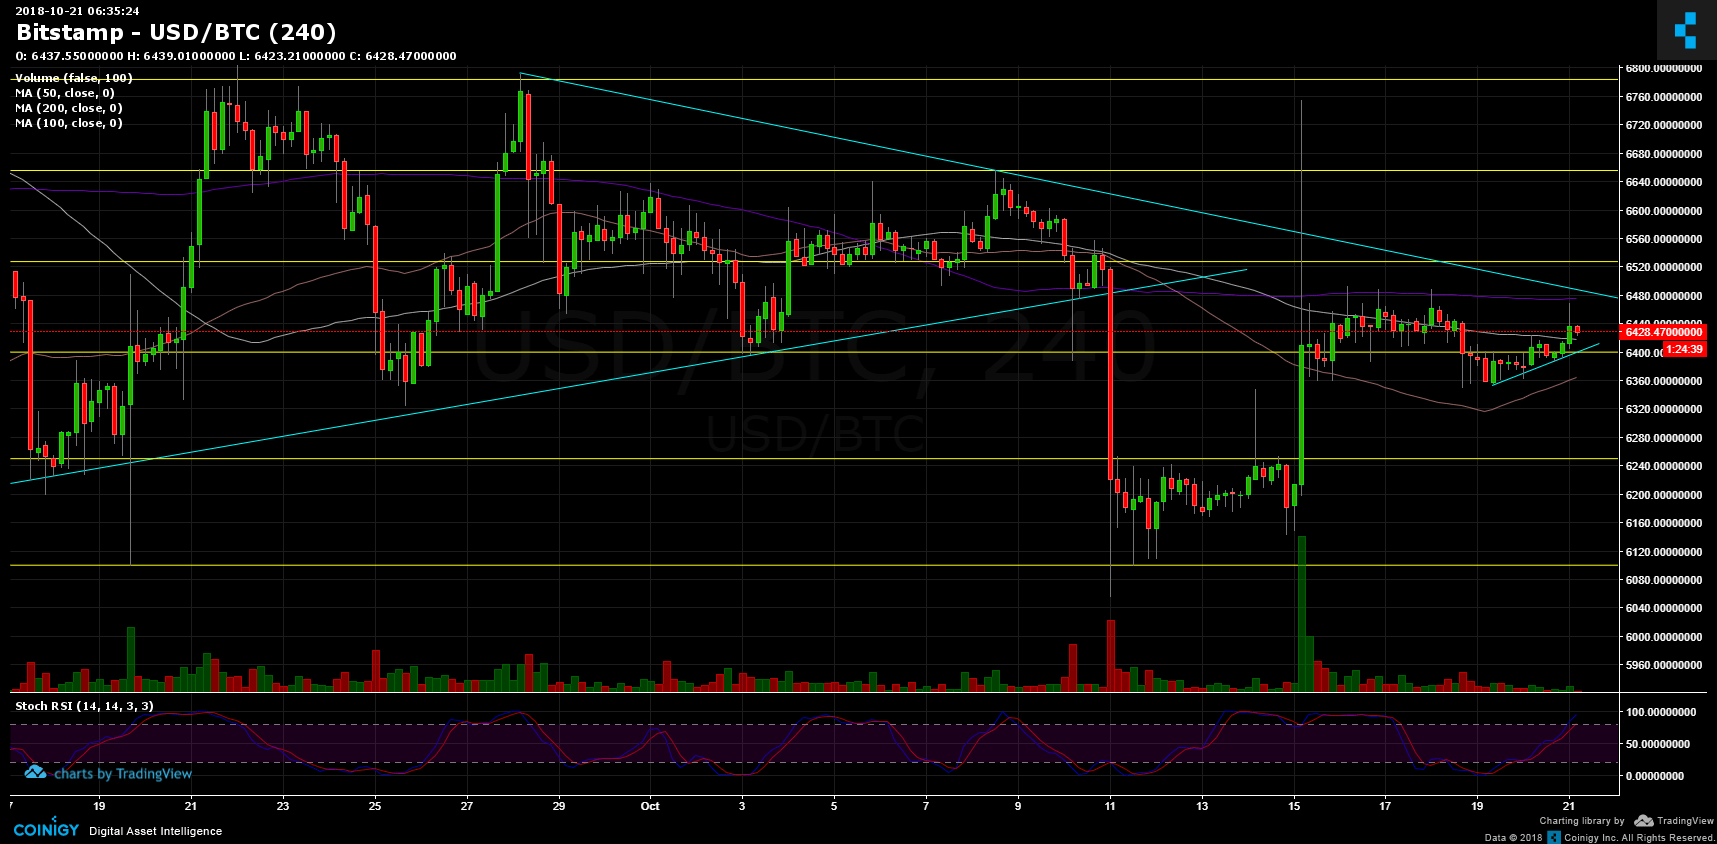
The 4-Hour Chart
Looking at the 4-hour chart, the price has recovered above the $56K support level after creating a double bottom pattern around $54K.
The cryptocurrency is currently running toward the $60K resistance level, and the bearish trendline demonstrated on the chart. If the market can break these resistance elements to the upside, market participants can be optimistic that a price recovery could materialize soon.

On-Chain Analysis
By TradingRage
Bitcoin Short-Term Holder SOPR
With Bitcoin’s price going through a correction, analyzing the behavior of investors, especially those who have recently entered the market, can yield beneficial insight. The Short-Term Holder SOPR metric would be a handy tool to achieve this end.
It measures the ratio of profits realized by investors holding their coins for less than six months. Values above 1 indicate profit realization, while readings lower than one show losses being realized on aggregate.
As the chart demonstrates, the 30-day exponential moving average of STH-SOPR has dropped below one and continues to decline. This shows capitulation by short-term holders, which could be one of the initial signs pointing to the end of the correction phase.

The post Bitcoin Price Analysis: BTC Not Quite Ready to Challenge $60K, Watch This Level First appeared first on CryptoPotato.