Bitcoin Price Analysis: BTC Likely Target $60K Following Today’s Breakout
Bitcoin saw a 7.5% price increase today as the cryptocurrency raised by a total of $1,640 to climb back above $54,000, for the first time since February 22.
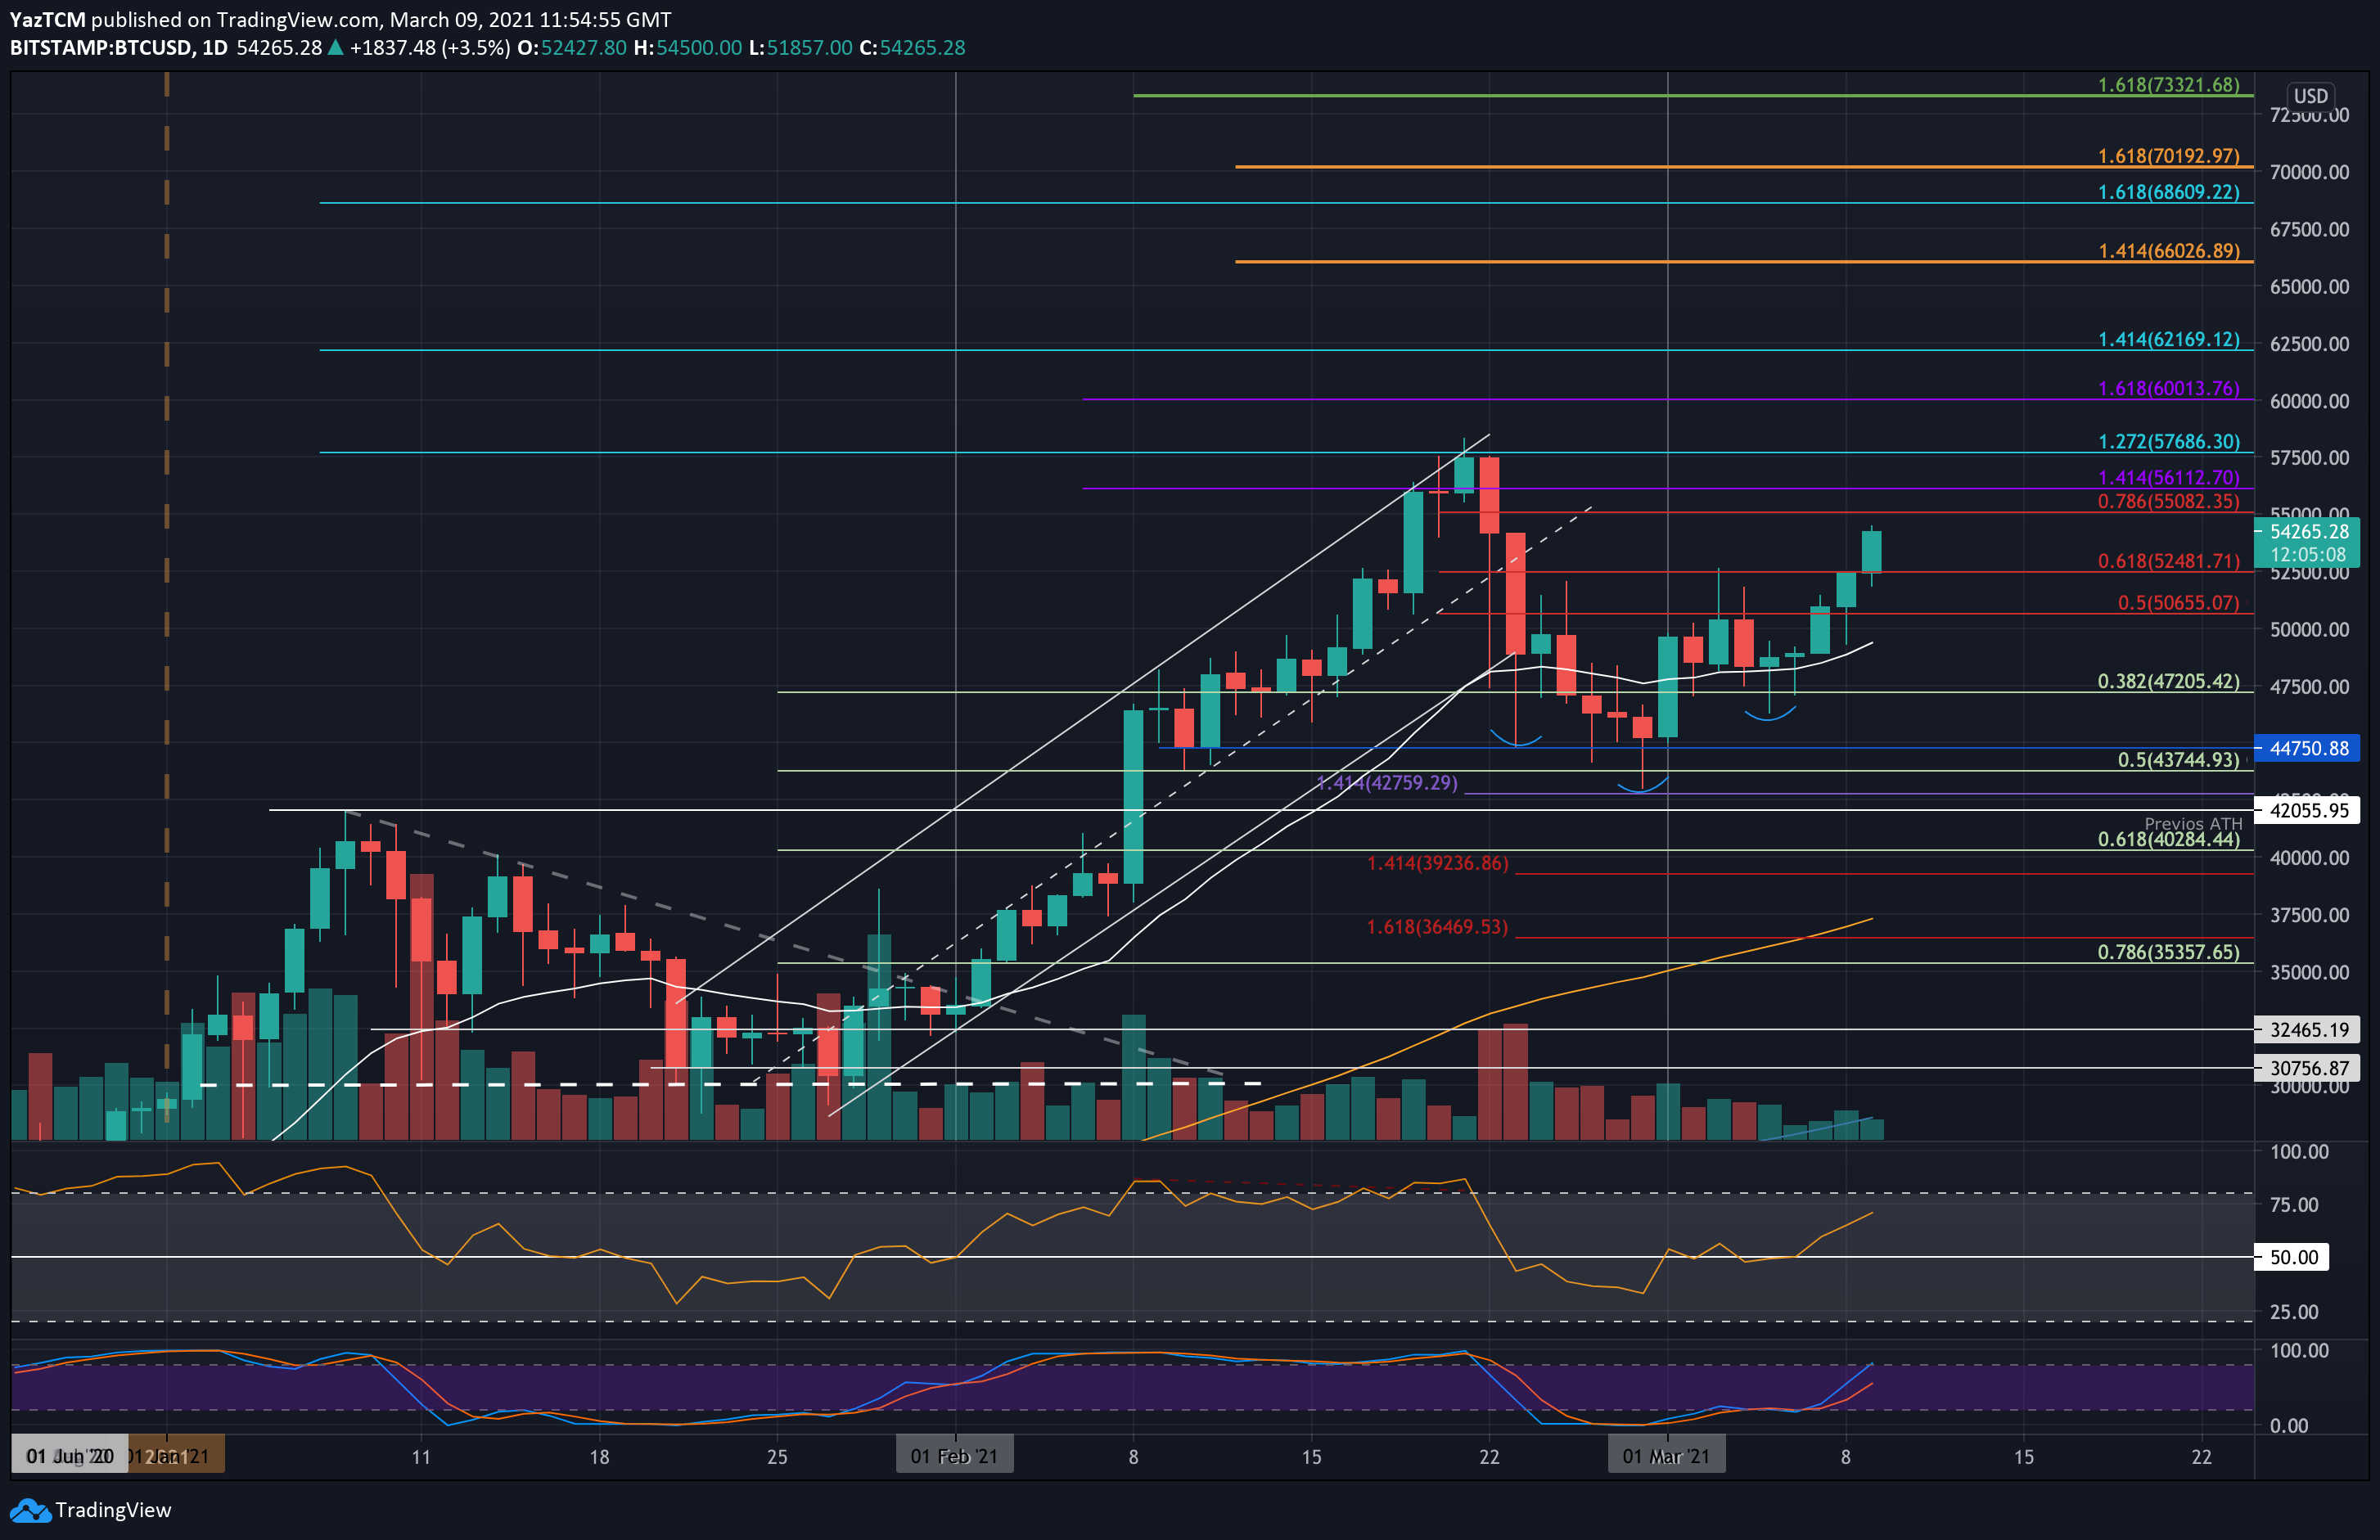
Looking at the past trading days, BTC had bounced from support at $47,200 (.382 Fib) over the weekend as it closed the daily candles above the critical 20-day EMA. On Sunday, it managed to break above $50,000 once again, which allowed it to push higher and close yesterday’s candle at $52,480 (bearish .618 Fib Retracement and crucial resistance area).
Today, Bitcoin continued above $52,480 but encountered the next major resistance at $54,000, where it is currently trading now.
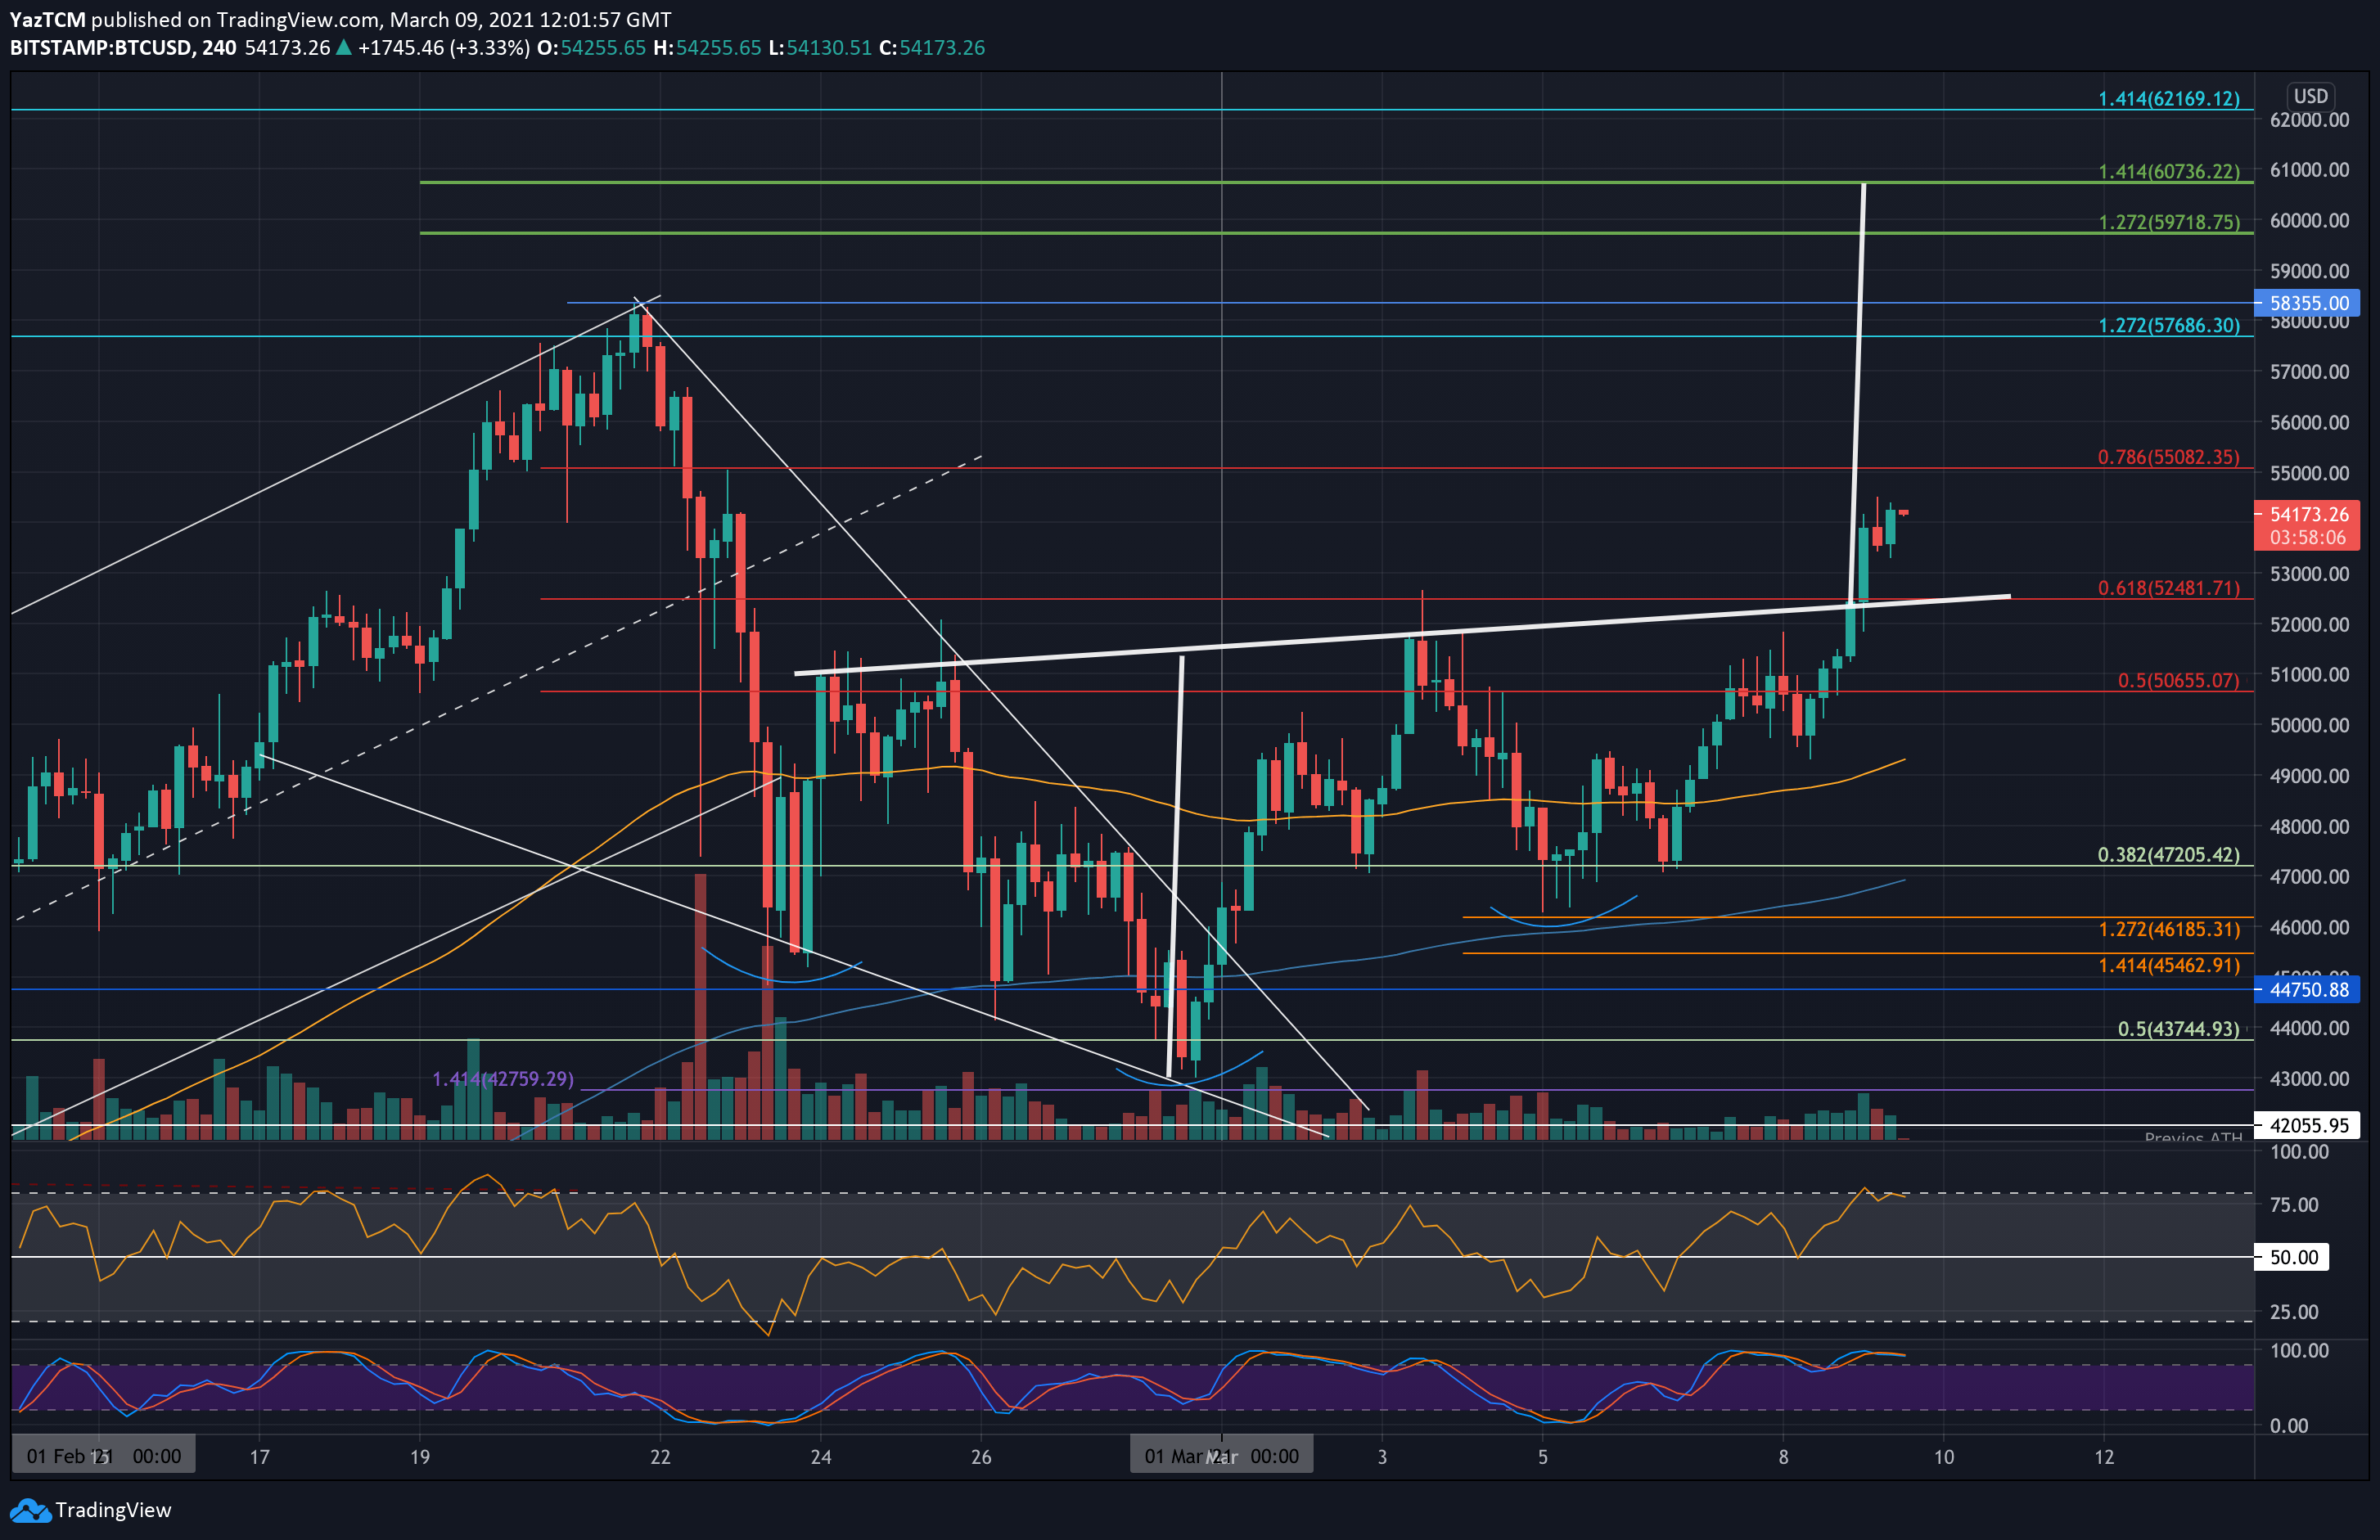
As mentioned in our previous analysis, an inverse Head & Shoulders pattern was forming on the 4-hour charts, indicated by the blue curves. In addition to this, there were also hints of bullish divergence showing toward the end of February, indicating the bearish pressure might be coming to a halt, along with rising demand around the $47-48K area, which marked a local bottom.
The surge above $52,480 today allowed Bitcoin to break the neckline of the H&S pattern as it starts to play out. The termination level of this pattern would provide a new ATH price at $60,736.
BTC Price Support and Resistance Levels to Watch
Key Support Levels: $53,000, $52,480, $51,000, $50,000, $47,200.
Key Resistance Levels: $54,000, $55,000, $56,112, $57,685, $58,355, $59,718 – $60,000.
Looking ahead, the first level of resistance beyond $54K lies at $55,000 (bearish .786 Fib Retracement). This is followed by $56,112 (1.414 Fib Extension – purple), $57,685 (1.272 Fib Extension – blue & ATH-day closing price), and then at $58,355 (ATH).
Beyond the ATH level, which was recorded on February 21, resistance lies at $59,718 (short term 1.272 Fib Extension – green), $60,000, and $60,736 (short term 1.414 Fib Extension – green & target level of the inverse H&S pattern).
On the other side, the first level of support lies at $53,000. This is followed by $52,480 (previous resistance), $51,000, and $50,000. Added support then lies at $47,200 (.382 Fib) and $44,750.
The daily RSI is now well above the 50 level as the bulls dominate the market momentum, indicating a bull run has already started to form.
Bitstamp BTC/USD Daily Chart

Bitstamp BTC/USD 4-Hour Chart


