Bitcoin Price Analysis: BTC Is Locked Inside a Bearish Descending Channel, $7000 Next Target?
Our previous price analysis had identified a tight range in which Bitcoin is trading inside. Over the past hours, this range is seemingly cracking down, to the downside.
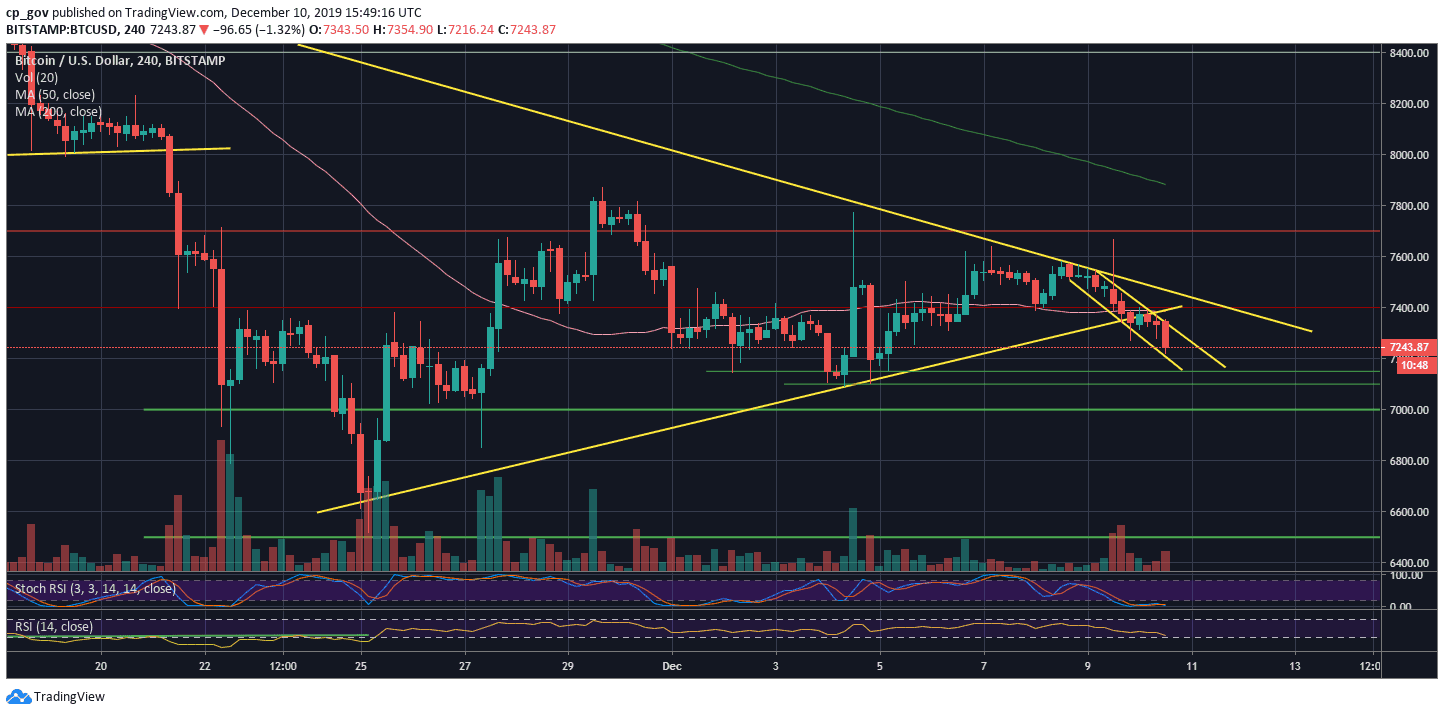
For the past five days, Bitcoin was trading between $7300 to $7600. Despite a fake-out that reached the mentioned resistance area of $7700, Bitcoin was trading inside a descending channel, which can be seen on the following 4-hour chart.
Adding negative indication coming on behalf of the Relative Strength Index (the RSI), as of now, it looks like Bitcoin would like to retest the $7000 area once again.
Total Market Cap: $198 billion
Bitcoin Market Cap: $132.3 billion
BTC Dominance Index: 66.8%
*Data by CoinGecko
Key Levels to Watch
– Support/Resistance: As of writing this, Bitcoin had recently marked $7250 as the current daily low. Further below lies $7150 support (weak), $7100, and $7000 support. The last includes a critical ascending trend-line (marked on the daily chart), which started forming since April 2019.
Further down is the $6800 horizontal support, before the $6500 area, which is Bitcoin’s 6-month low.
In the case of a correction, the first resistance is the 4-hour marked descending channel. A little above lies the $7400 resistance, along with the mid-term descending trend-line. Further above lies the $7700 – $7800 horizontal resistance.
– The RSI Indicator: In our previous analysis, we had identified the 45 RSI level as a crucial resistance. Unfortunate to the Bulls, Bitcoin failed in breaching it, and over the past two days, the RSI is declining and losing momentum, in correlation with the price.
– Trading volume: Following low-volume days, Bitcoin finally has seen some price action. However, this is far from reaching near the top volume days of the past month.
BTC/USD BitStamp 4-Hour Chart

BTC/USD BitStamp 1-Day Chart

The post Bitcoin Price Analysis: BTC Is Locked Inside a Bearish Descending Channel, $7000 Next Target? appeared first on CryptoPotato.


