Bitcoin Price Analysis: BTC Is Back At $8000, Two Bullish Signs For The Coming Weekend
Following the recent days’ break down of the significant $8000 level in Bitcoin’s price, we had seen the coin recording its weekly low around $7450 (Bitstamp).
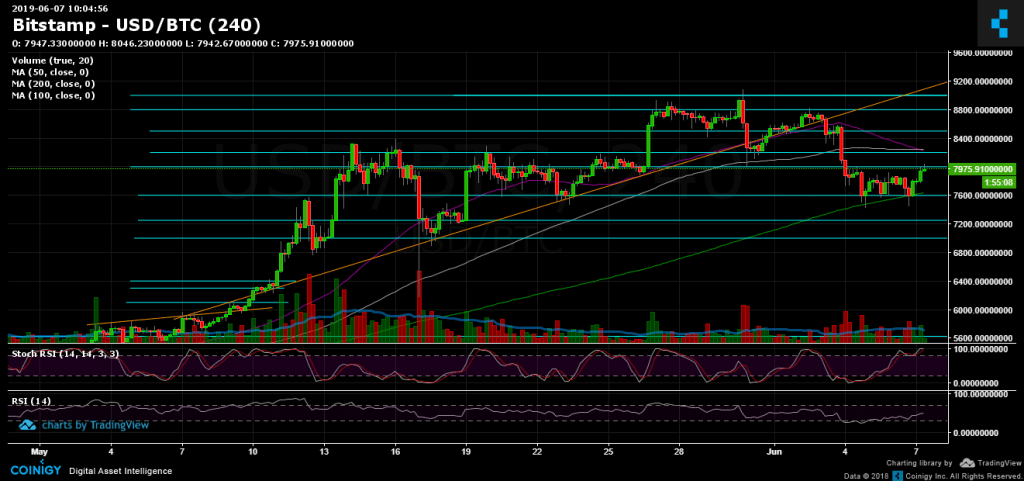
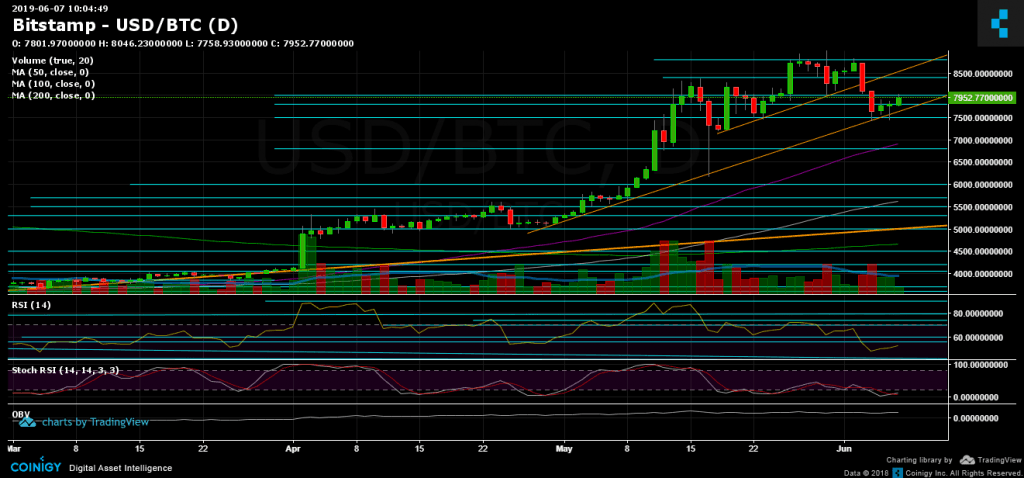
The good news for the bulls is that the support area of $7500 did hold and not for the first time: The strong support area was combined of the mid-term ascending trend-line (marked in orange, 1-day chart) along with the 4-hour chart’s MA-200. Since yesterday the bulls had returned and Bitcoin had tested the $8000 level but from below. As of now, Bitcoin is facing the $8000 support turned resistance area.
Another thing to keep in mind is Bitcoin’s behavior during recent weekends. Maybe due to the low activity of the heavy traders, the bulls are in control at the end of the week and so far most of 2019 weekends were bullish for Bitcoin.
Total Market Cap: $255 Billion
Bitcoin Market Cap: $141.6 Billion
BTC Dominance: 55.5%
Looking at the 1-day & 4-hour charts
– Support/Resistance:
From the bullish side, the closest level of resistance is the $8000 area (as mentioned). Further above lies $8200 – $8250 (the 4-hour chart’s MA-50 and MA-100), $8400, $8500, $8800 and the 2019 high around $9000 – $9100.
From below, the nearest level of support is the $7700 – $7800 level, along with the mid-term ascending trend-line. Further below lies $7600 and $7500, which proved as significant support for the second time in two weeks. Below lies the $7250 and $7000, which is also the daily chart’s 50 days moving average line (marked in purple).
– Trading Volume: The recent severe decline two days ago was followed by massive amount of volume, so far today’s volume isn’t significant, but let’s see how the daily volume candle closes.
– Daily chart’s RSI: Following the drop to the 47 RSI support zone, we saw a reversal with a slow come back above 50. As of now, the RSI faces resistance of the 54-55 level.
– BitFinex open short positions: Over the past two days, the shorts had reduced dramatically, and the open short positions number is currently standing at 17.6 K BTC positions. Long squeeze coming?
BTC/USD BitStamp 4-Hour Chart
BTC/USD BitStamp 1-Day Chart
The post Bitcoin Price Analysis: BTC Is Back At $8000, Two Bullish Signs For The Coming Weekend appeared first on CryptoPotato.

