Bitcoin Price Analysis: BTC Finds Support at 50-Day MA But Will It Hold?
Bitcoin continues to recover from the tumble it suffered during the weekend. As of now, the BTC price is up by 3% today, following the 14% devastating crash seen on Sunday.
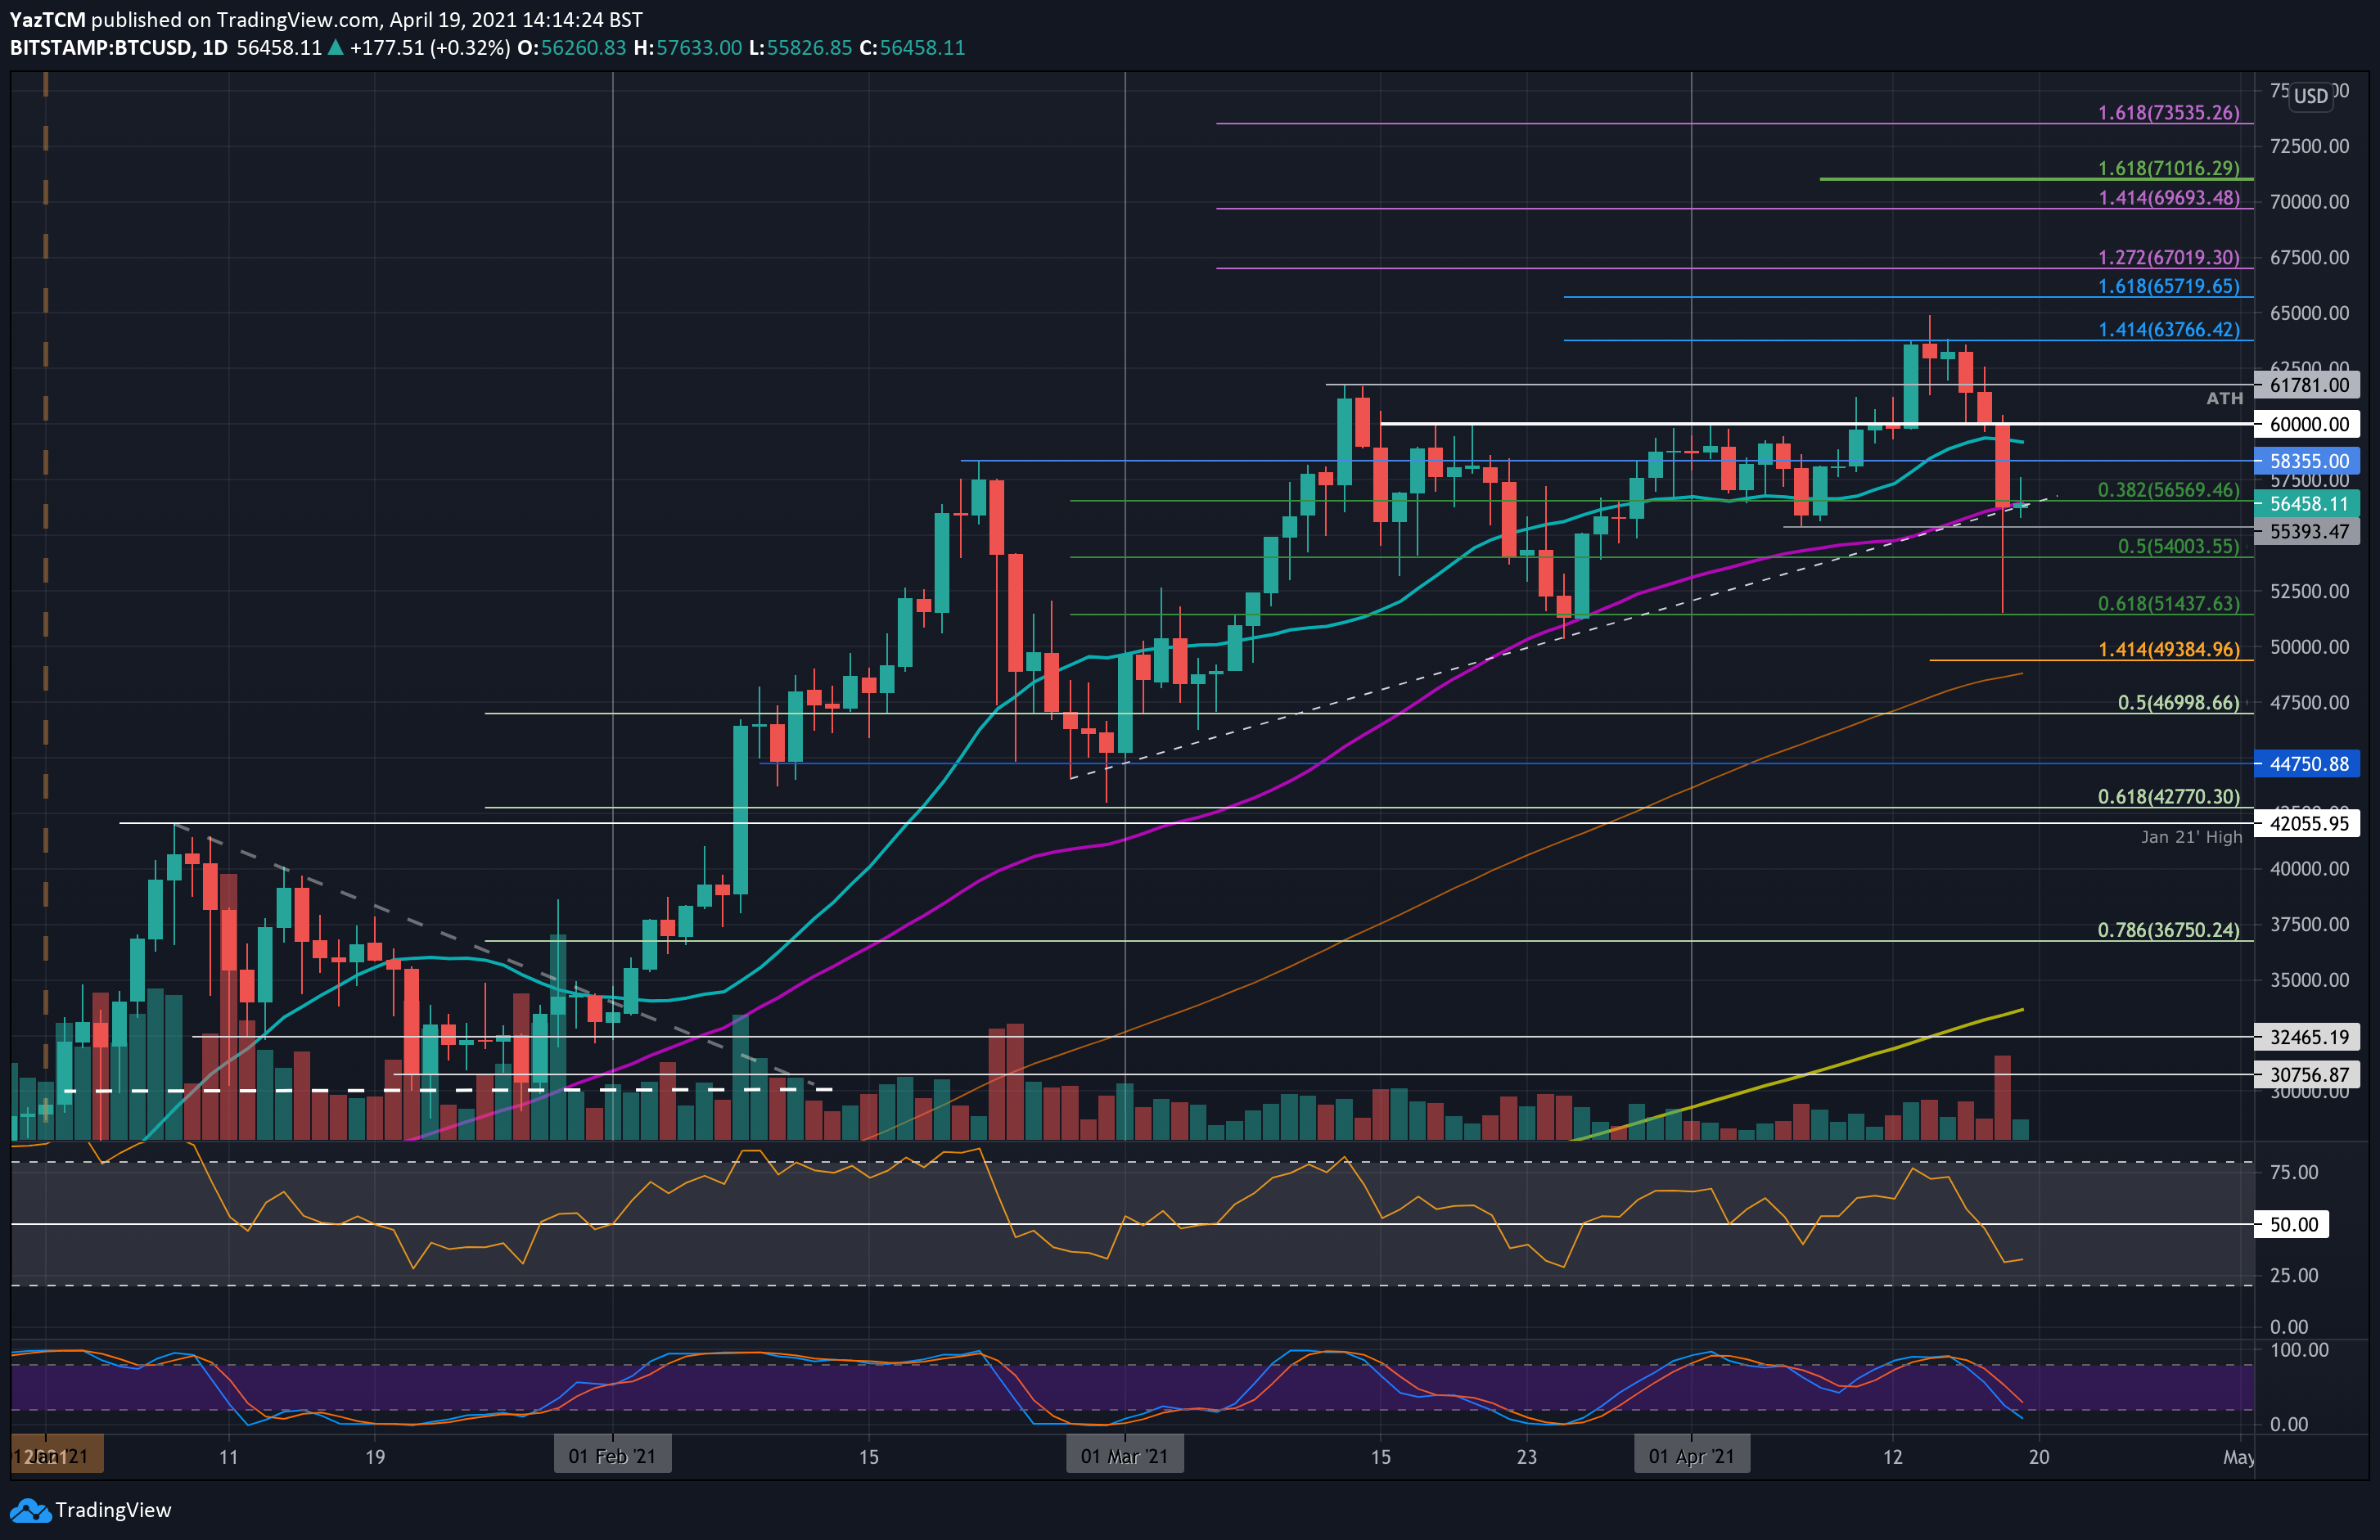
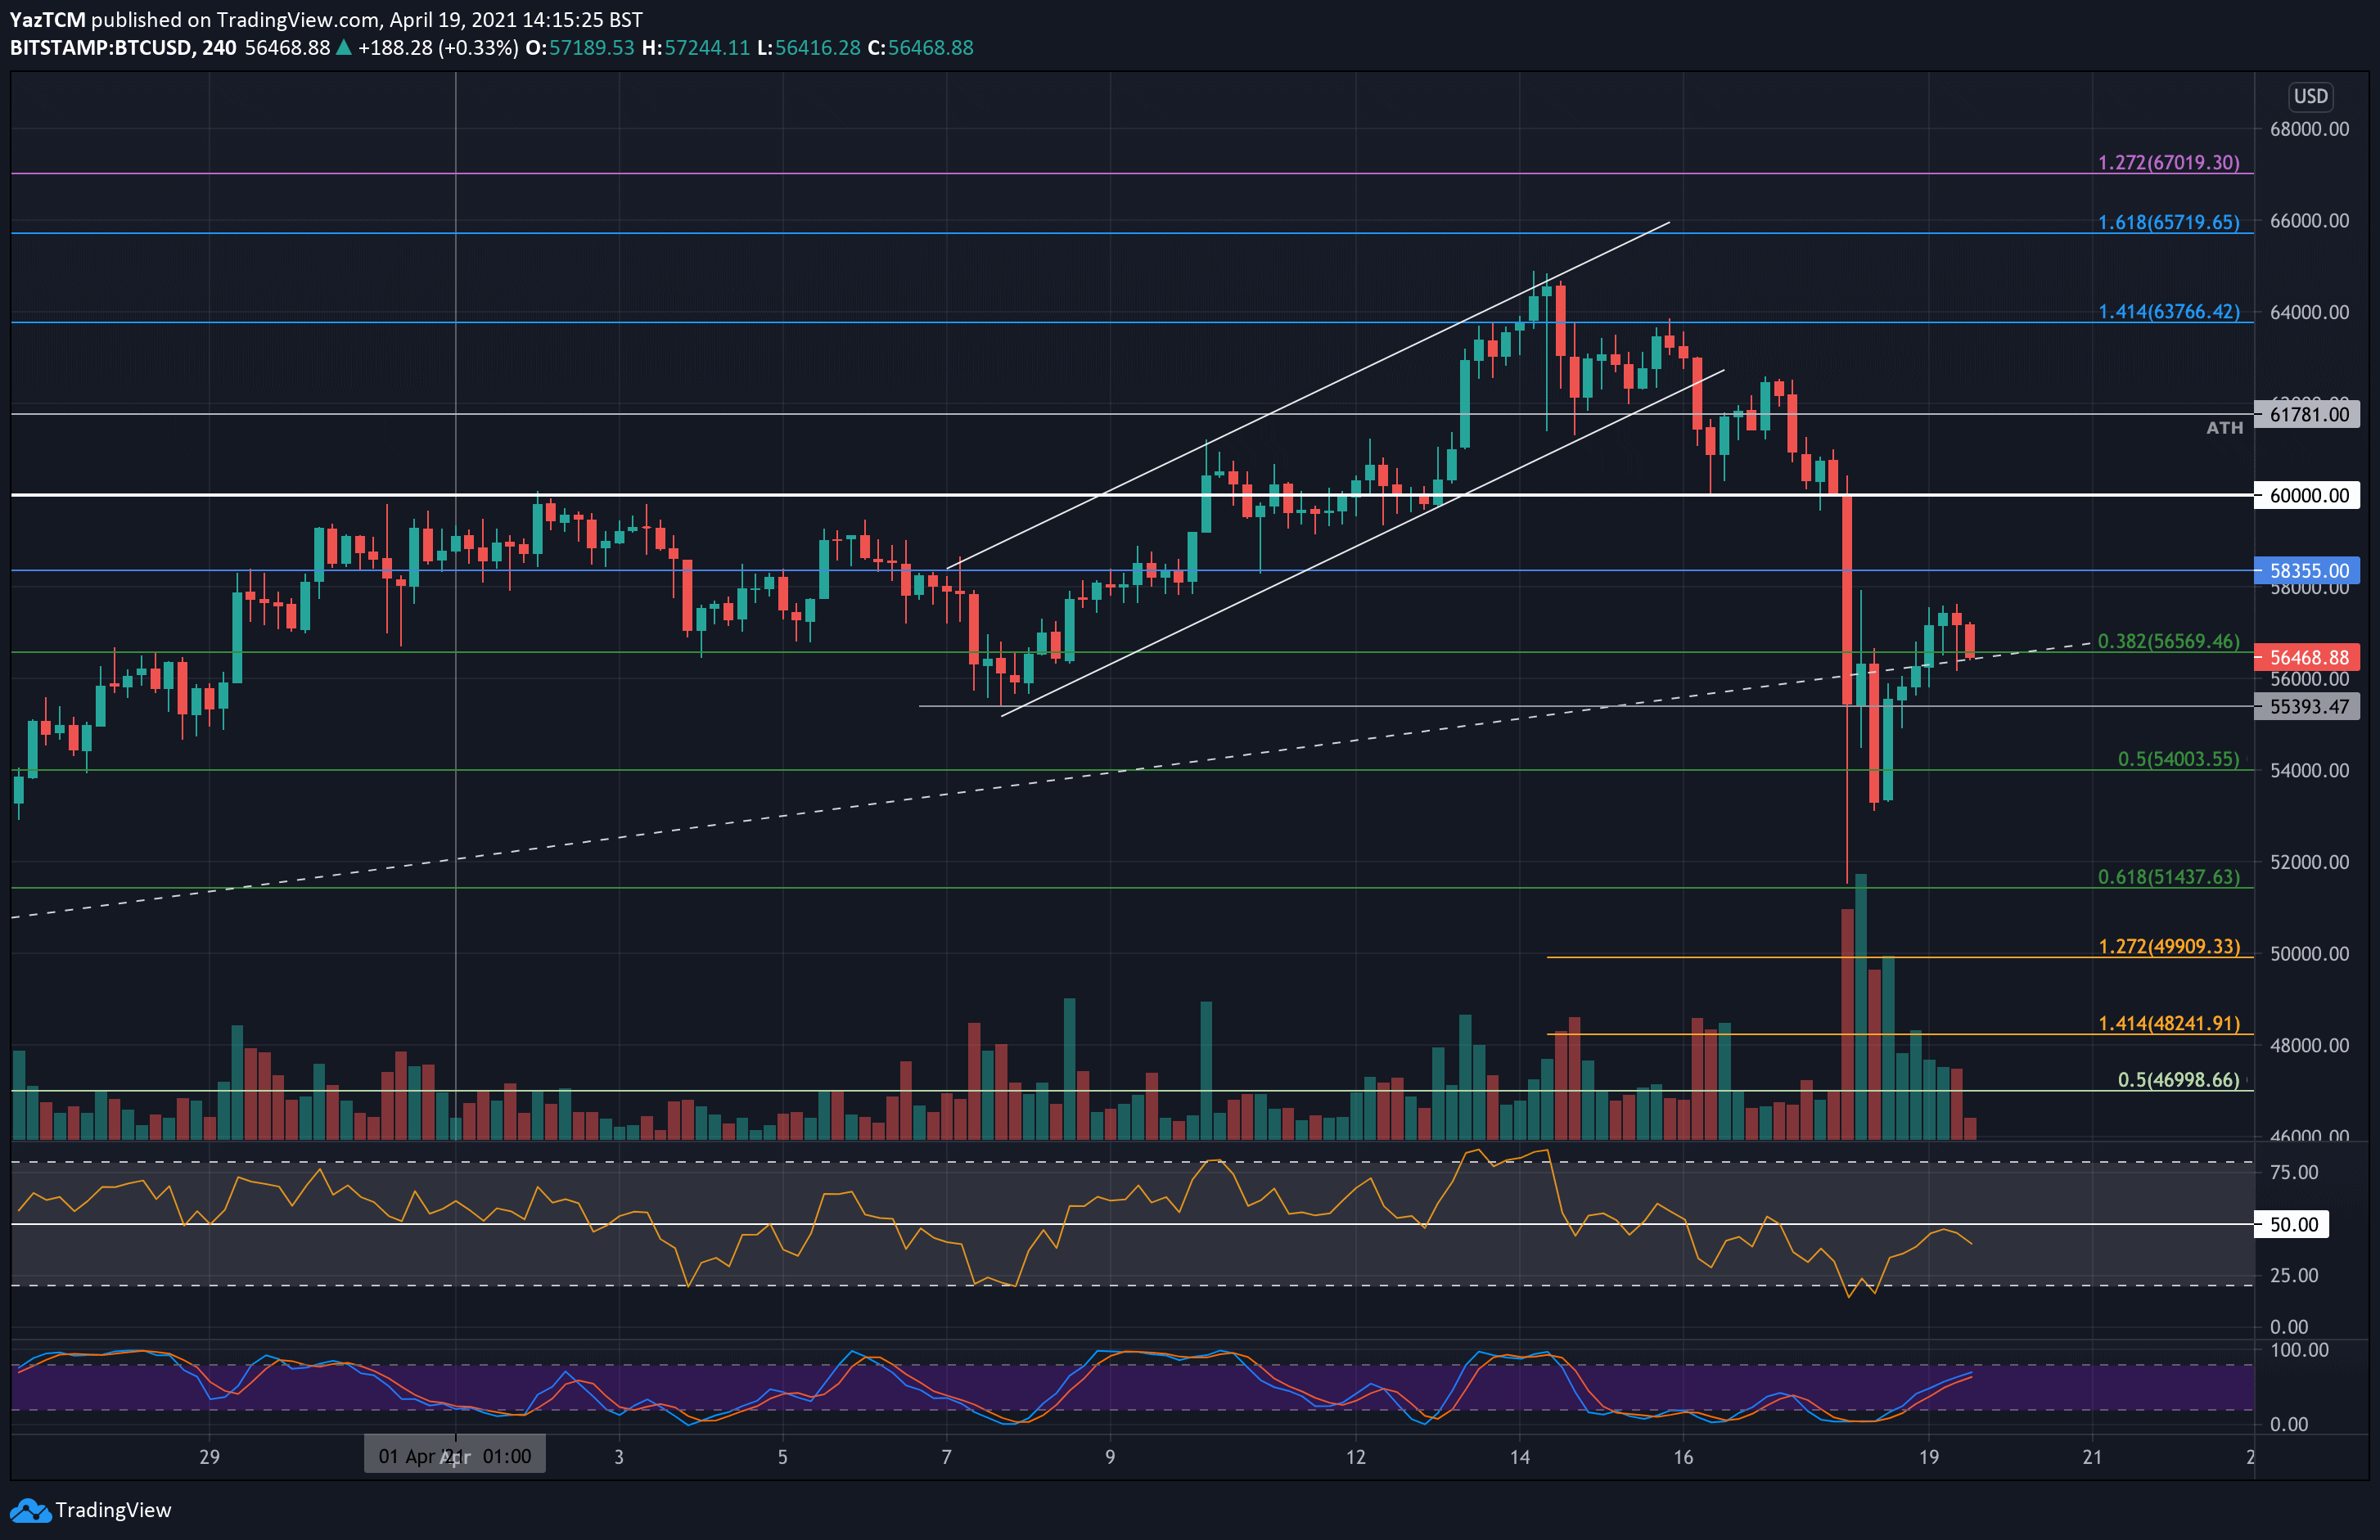
Yesterday, Bitcoin slipped from the $60k price area as it dropped to reach as low as $51,440. There, it found support at the .618 Fib Retracement level and managed to rebound, trading between $54k – $55k during most of the day.
By the end of the day, Bitcoin managed to recover to $56,280, where it found support at a 50-days MA level. This was further bolstered by an ascending trend line that dates back to the beginning of March.
Today, Bitcoin has battled to remain above the 50-days MA but looks to be struggling to hold the support, even at the time of this writing.
BTC Price Support and Resistance Levels to Watch
Key Support Levels: $55,400, $54,000, $51,440, $50,000, $49,385.
Key Resistance Levels: $56,280, $58,355, $59,200, $60,000.
Looking ahead, if the sellers push beneath the 50-days MA the first support lies at $55,400 (early April support). This is followed by $54,000 (.5 Fib), $51,440 (.618 Fib), and $50,000. Beneath $50,000, added support lies at $49,385 (downside 1.414 Fib Extension), and $47,000 (long term .5 Fib).
On the other side, the first resistance lies at the 50-days MA at $56,280. This is followed by $58,3555 (Feb Highs), $59,200 – the 20-day moving average line, and $60,000.
The daily RSI is now beneath the midline and is at its lowest value in April, indicating that the bears are in complete control of the short-term momentum.
Bitstamp BTC/USD Daily Chart

Bitstamp BTC/USD 4-Hour Chart


