Bitcoin Price Analysis: BTC Finally Breaks Up, 2019 New High Soon?
After ten days of consolidation, Bitcoin finally manages to break up the $8200 – $8250 resistance area.
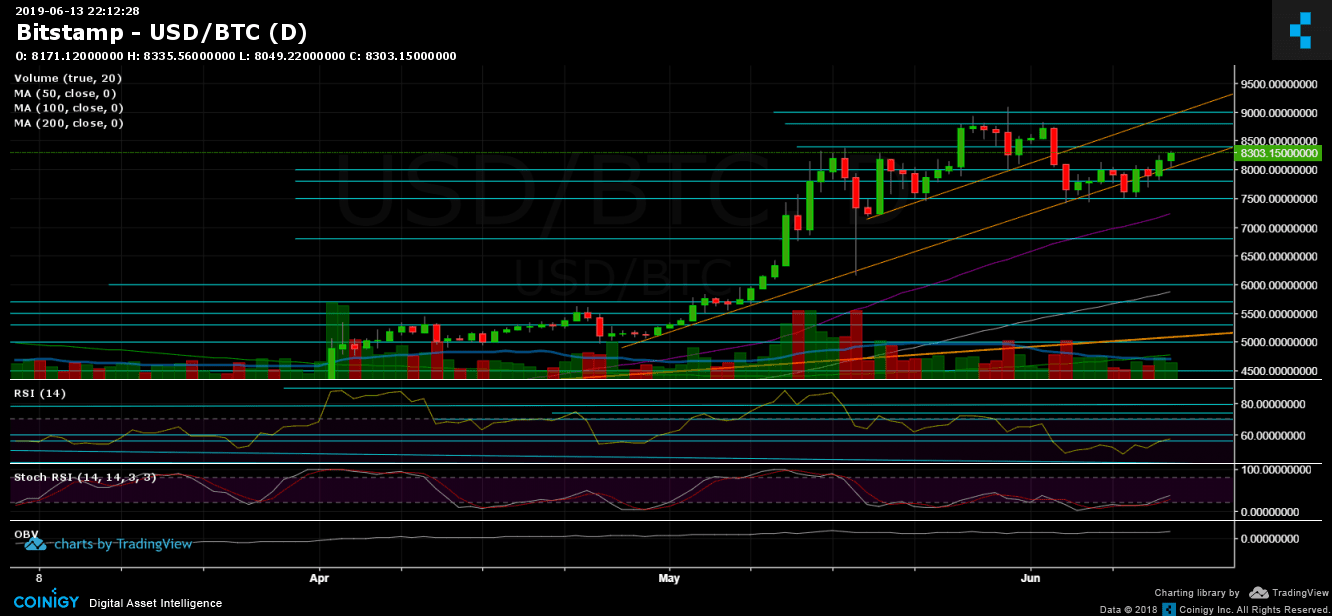
Since retesting the critical support at $7500, Bitcoin has seen four consecutive days of gains, whereas the coin keeps following the mid-term ascending trend line (marked in orange on the daily chart).
On our recent analysis, we mentioned how important it is for BTC keep above the mentioned $7500 area, and that in that case, the coin can go much higher.
Bullish sentiment is coming from the Stochastic RSI oscillator: Recently, it had gone through a cross over in the oversold area and entered the bullish territory.
Total Market Cap: $266 Billion
Bitcoin Market Cap: $147.5 Billion
BTC Dominance: 55.4%
Looking at the 1-day & 4-hour charts
– Support/Resistance:
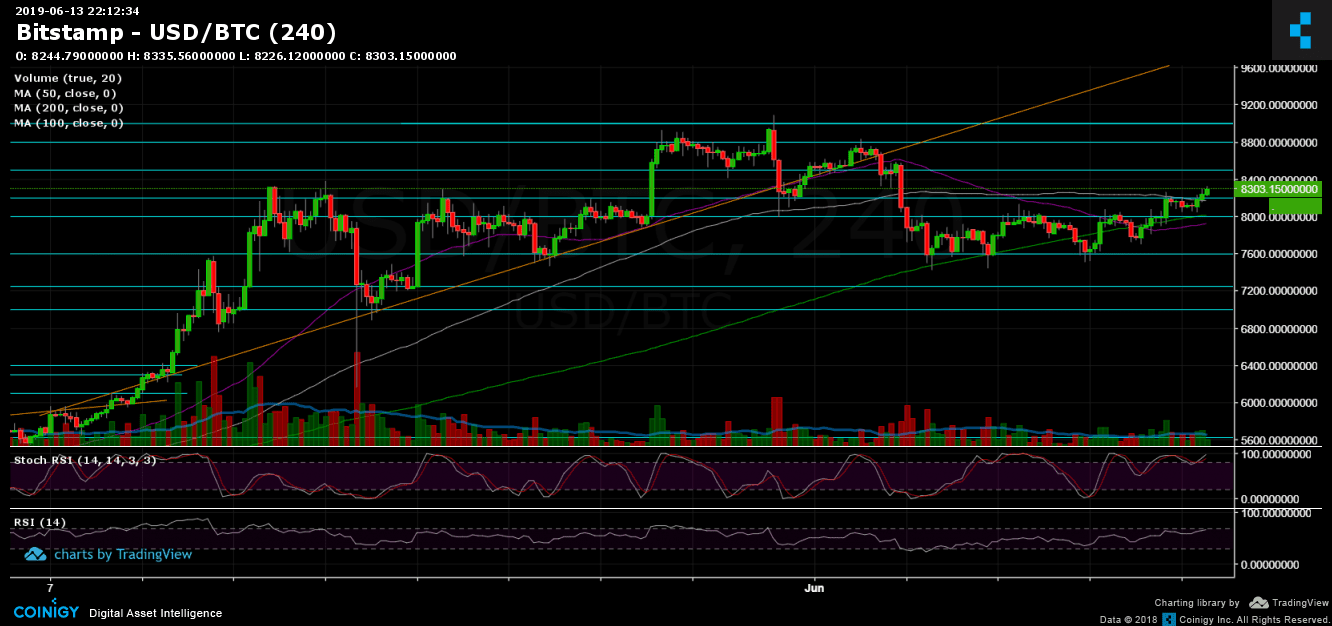
From above, following the breakout of the $8200 – $8250 area, which includes the 4-hour chart’s MA-100 (marked with a white line), Bitcoin is now facing resistance levels at $8400, $8500, $8800 and the 2019 high around $9000 – $9100.
From below, the nearest level of support is now the resistance turned support level at $8000 – $8100. Below lies the $7700 – $7800 area. Further below lies $7600 and the strong support at $7500 (the low of the past week).
– Trading Volume: A 5-days high followed the recent move, however, the volume is not significant yet (compared to May 2019).
– Daily chart’s RSI: After forming a double-bottom around the 47 RSI level, the indicator had seen a nice increase back to the 56 area, which is the bullish territory, with a space to go higher. As mentioned above, Stochastic RSI had recently gone through a cross over in the oversold area, which could turn into a bullish move.
– BitFinex open short positions: Along with the rising Bitcoin, the short positions are rising as well. There are currently 20.8 K BTC of open short positions, which is a 10-day high.
BTC/USD BitStamp 4-Hour Chart
BTC/USD BitStamp 1-Day Chart
The post Bitcoin Price Analysis: BTC Finally Breaks Up, 2019 New High Soon? appeared first on CryptoPotato.