Bitcoin Price Analysis: BTC Enters Near-Term Pullback, Is Local Bottom Found?
BTC’s recent 46% rally from the lows at $39.6k has been very impressive as prices pushed above $50k, the September high at $52.9k, with higher highs being made.
The above further validates the completion of the bear trap down to $39.6k. Bitcoin has been finding initial resistance as anticipated in the $57.1k to $58.3k, a major zone of technical and on-chain resistance.
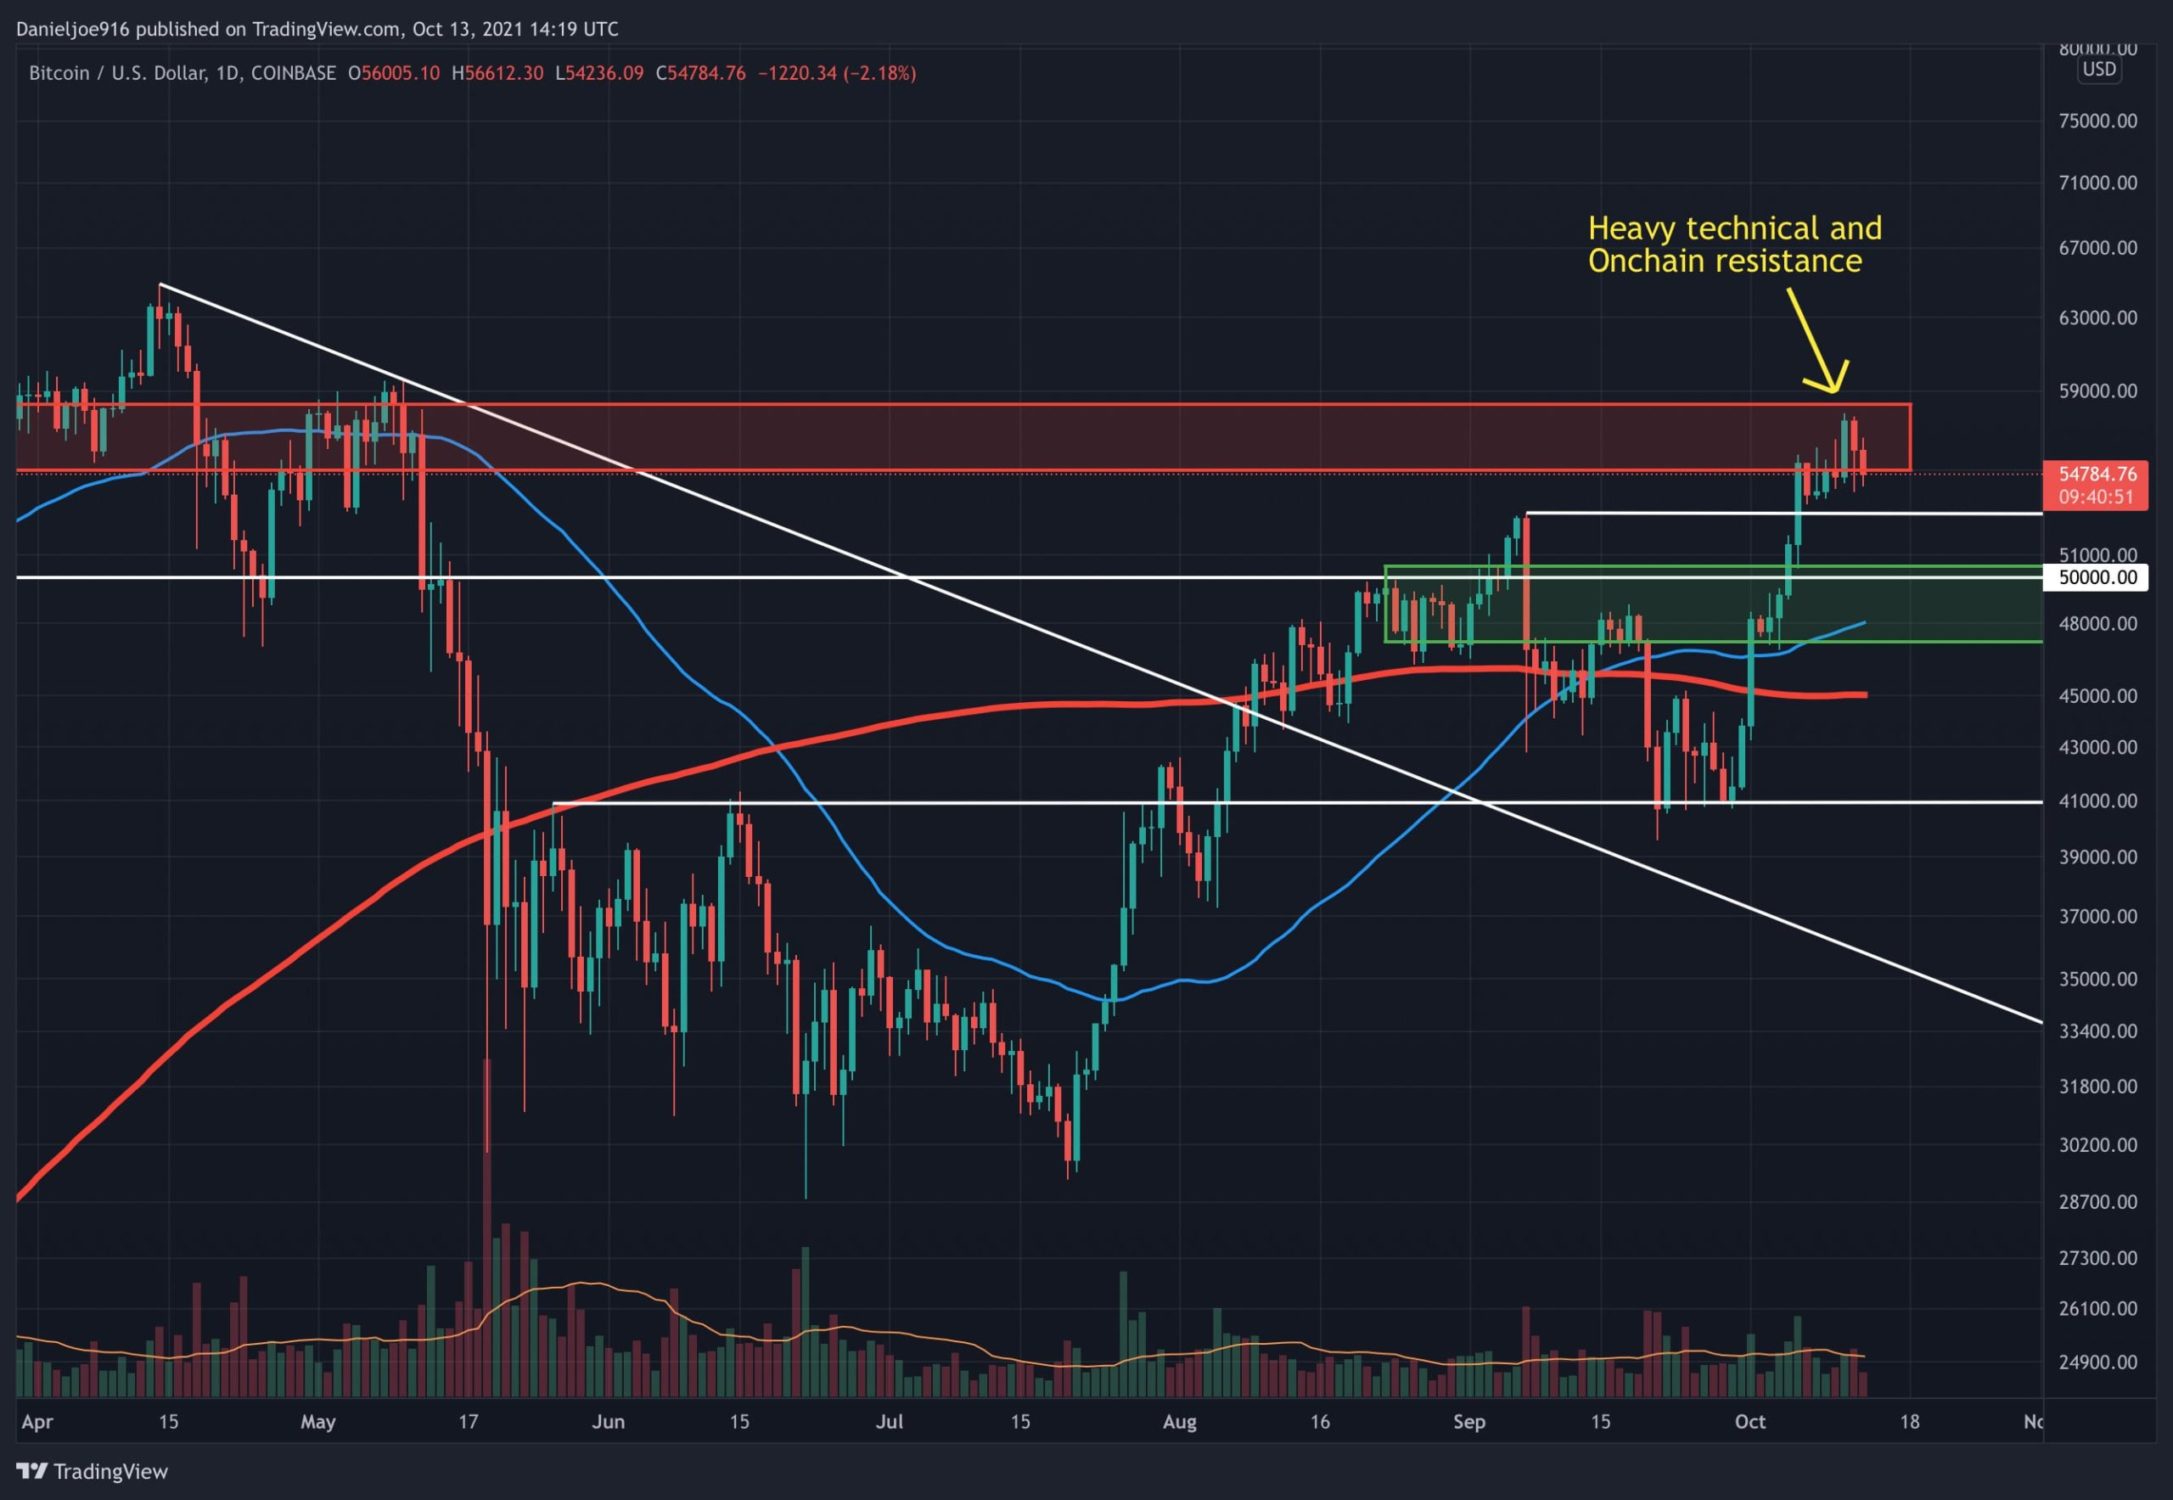
The $50k to $58.3k zone includes many buyers from earlier this year who acquired Bitcoin during the large run-up to $64.8k. Although many of these buyers panic-sold the lows at $30k, there are likely remaining holders looking to break even or realize a small profit at current levels, which indicates potential near-term selling pressure.
Near-Term Cautious – Overall Trend Remains Bullish
The near-term technicals are slightly cautious given the more than 45% rally, overbought conditions, slightly elevated open interest and funding rates, and light distribution on the chain. Historically, increasing open interest with funding rates trending higher along with rapid price appreciation have led to near-term pullbacks in the market. Additionally, spot inflows started to trend higher, causing spot exchange reserves to increase, indicating potential profit-taking.
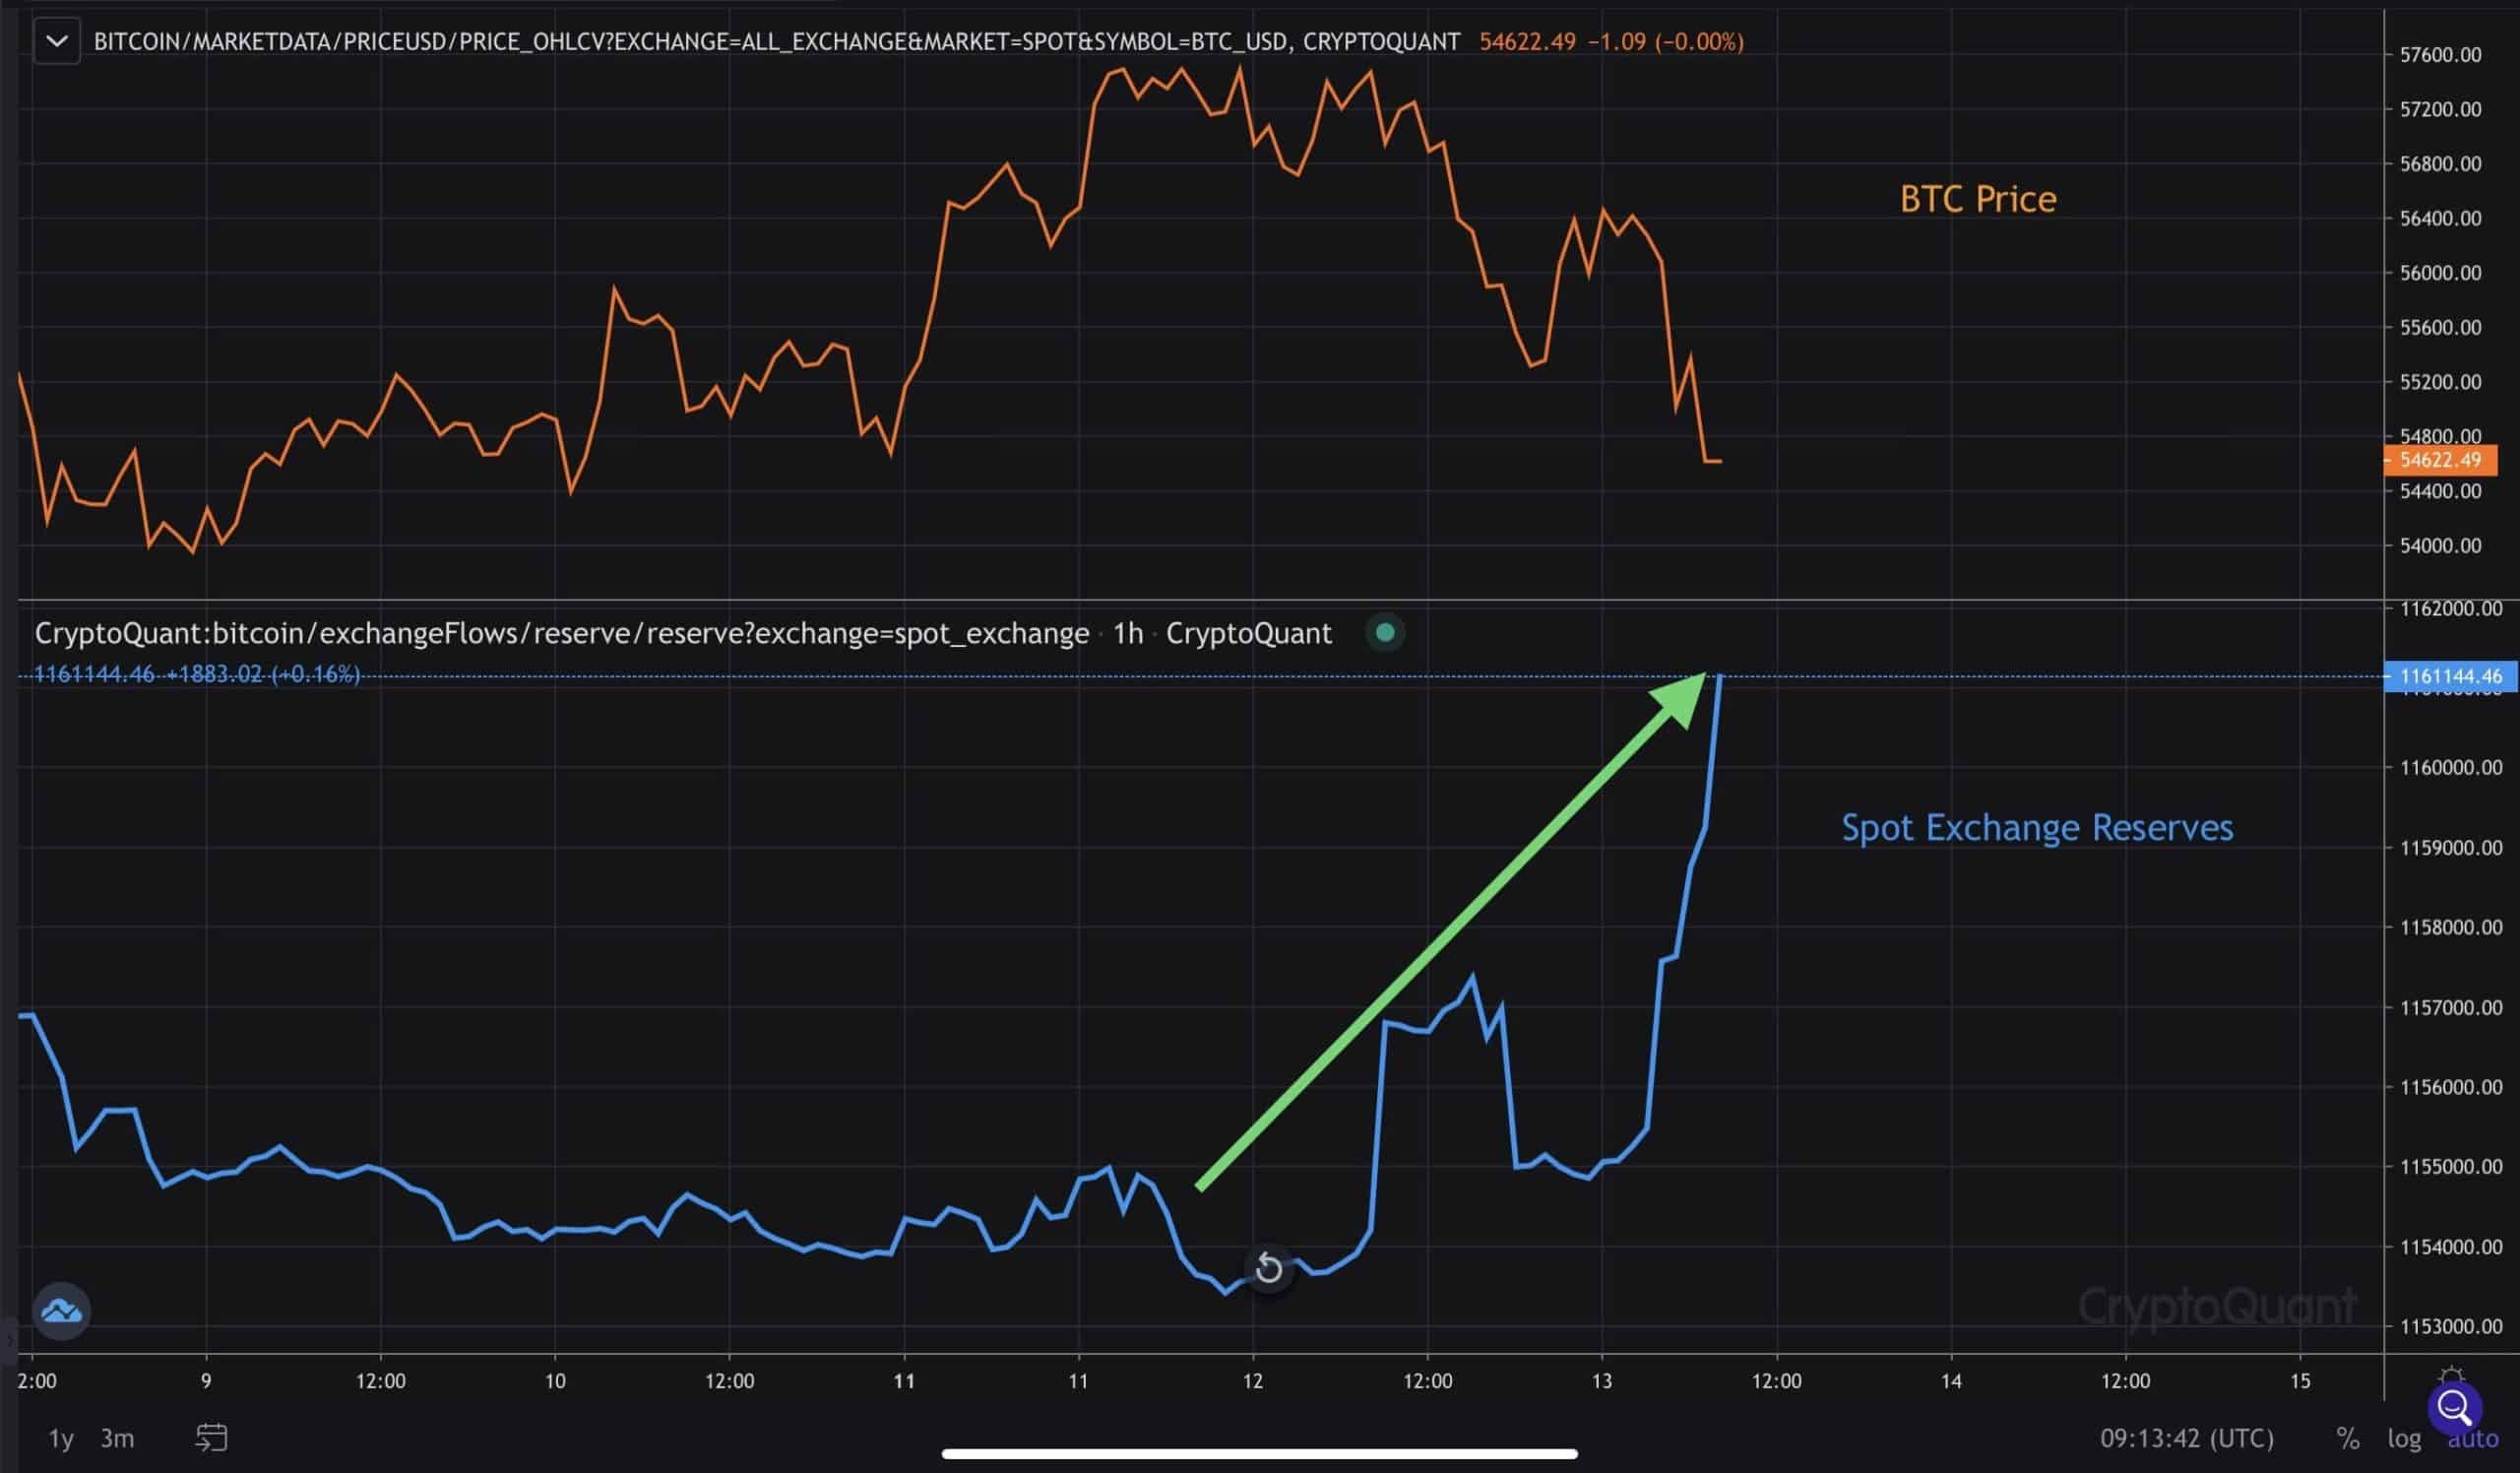
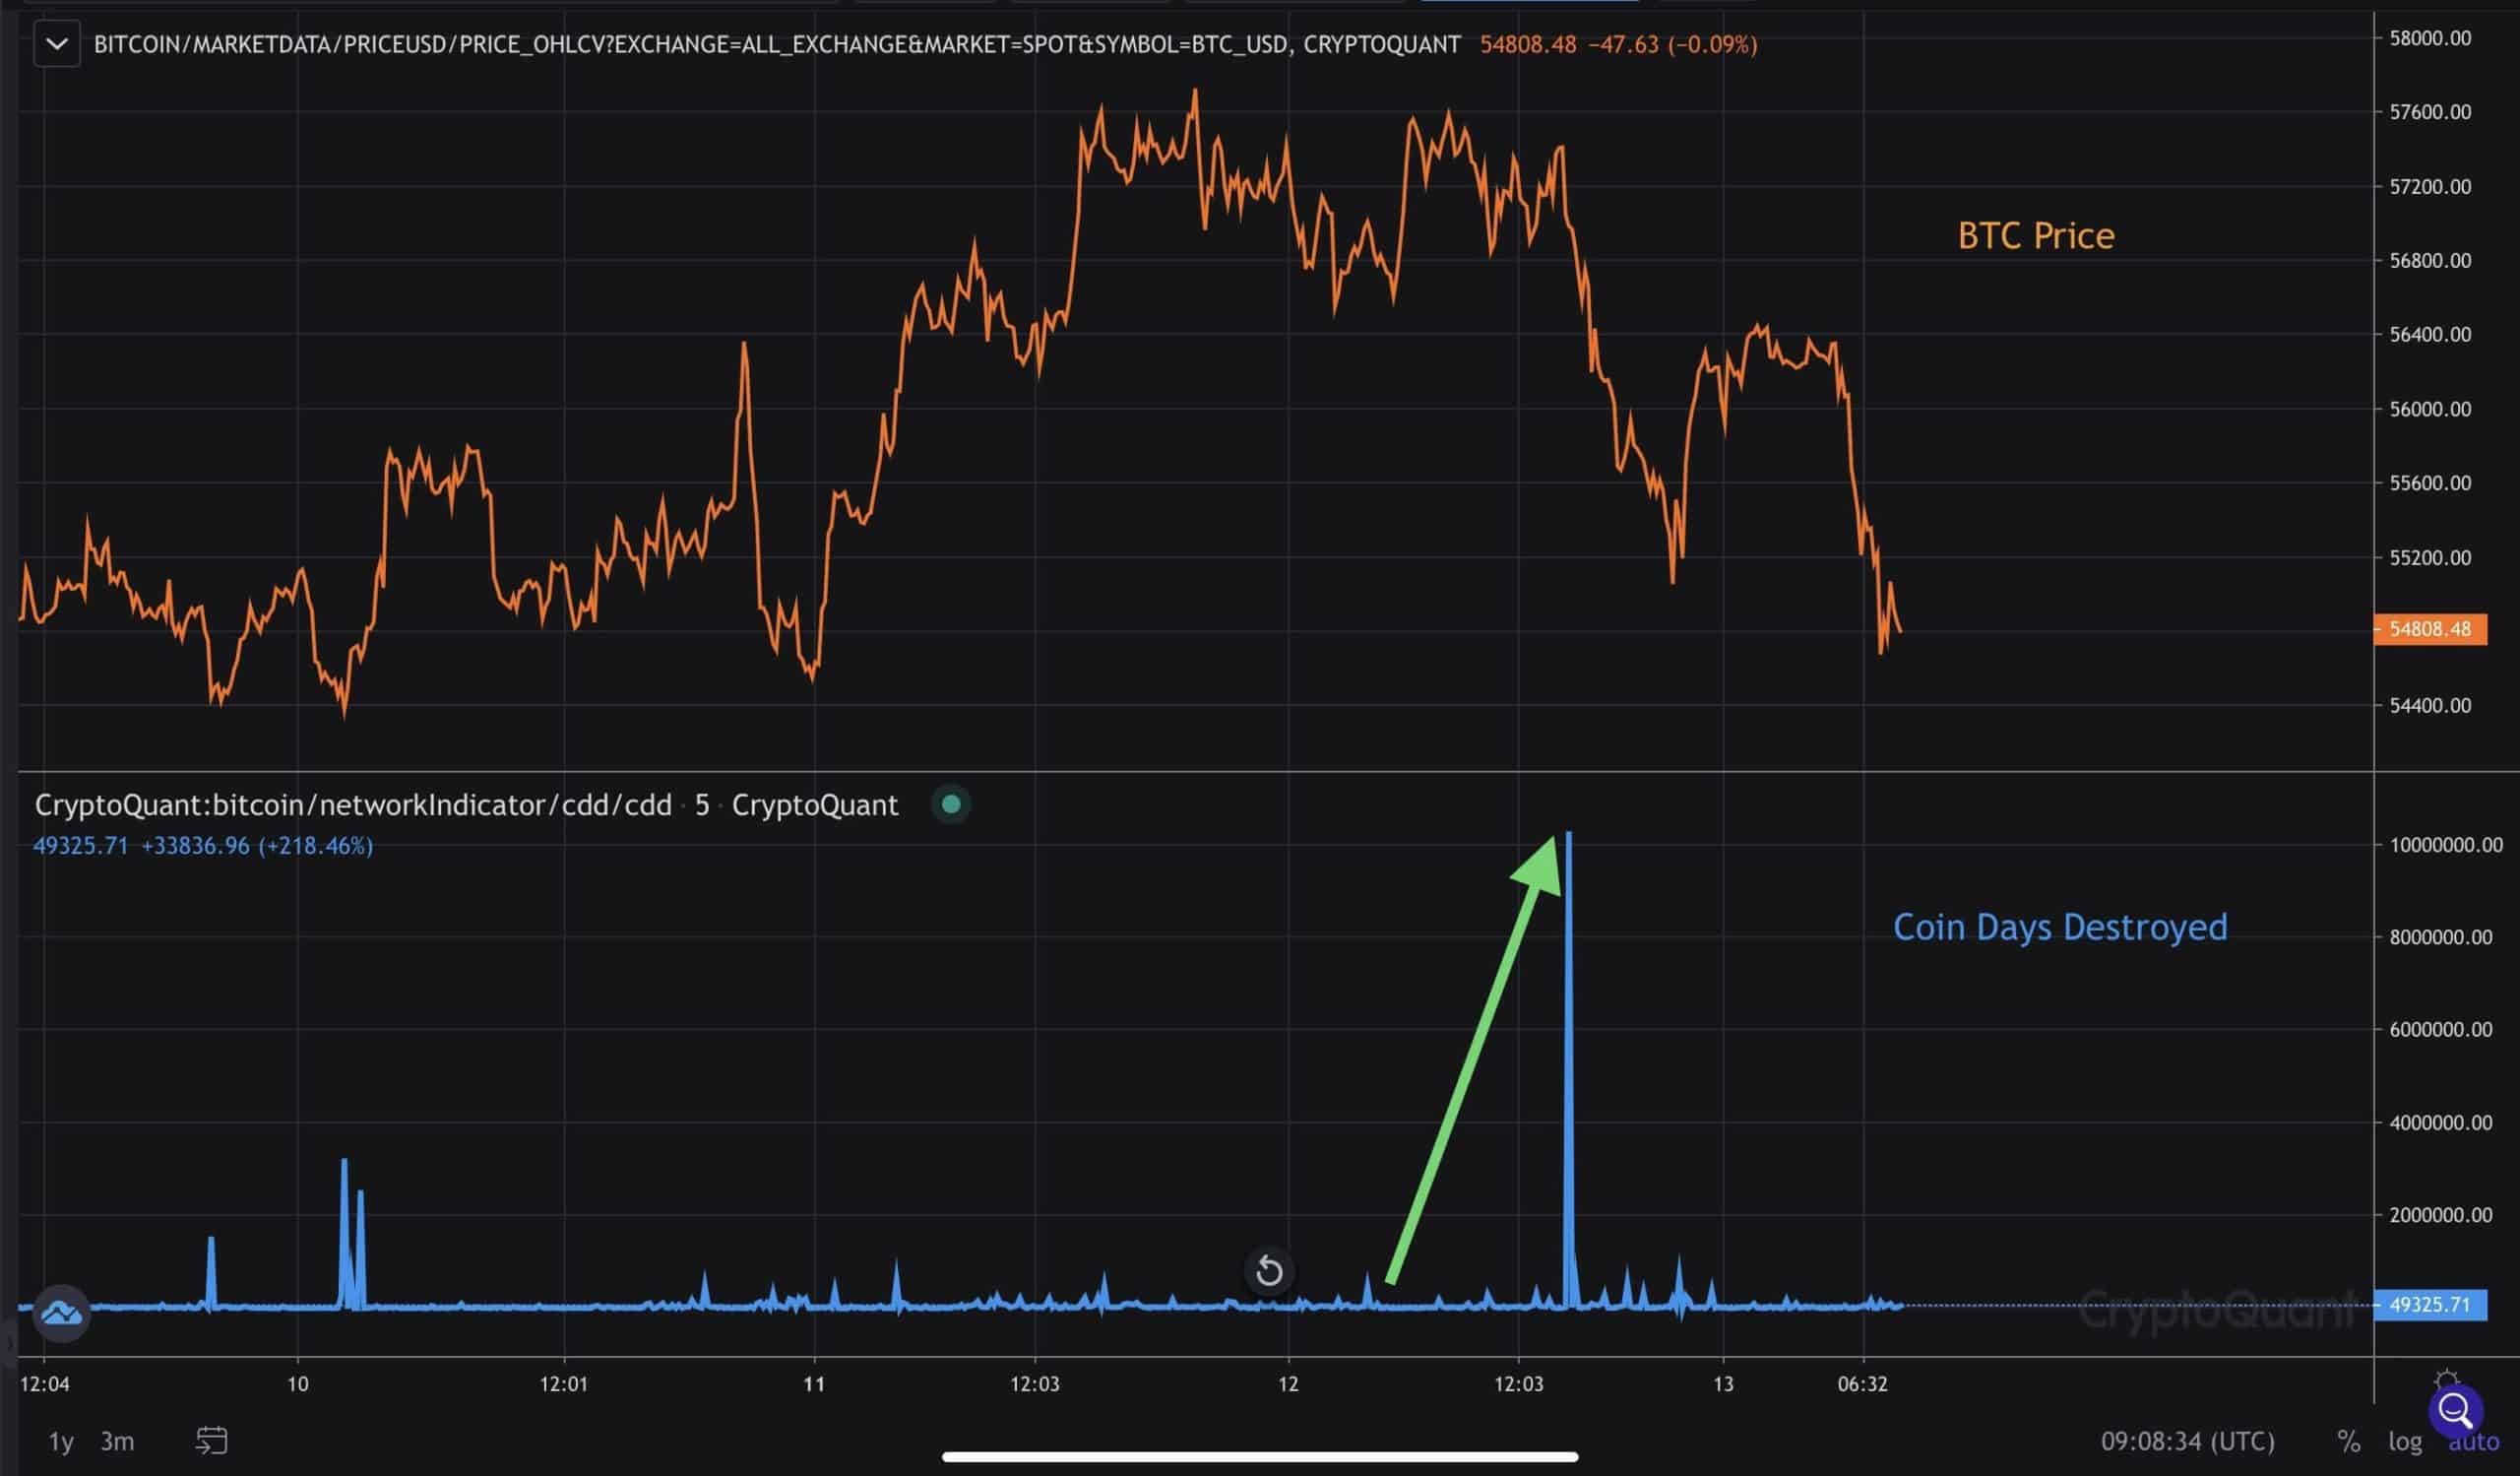
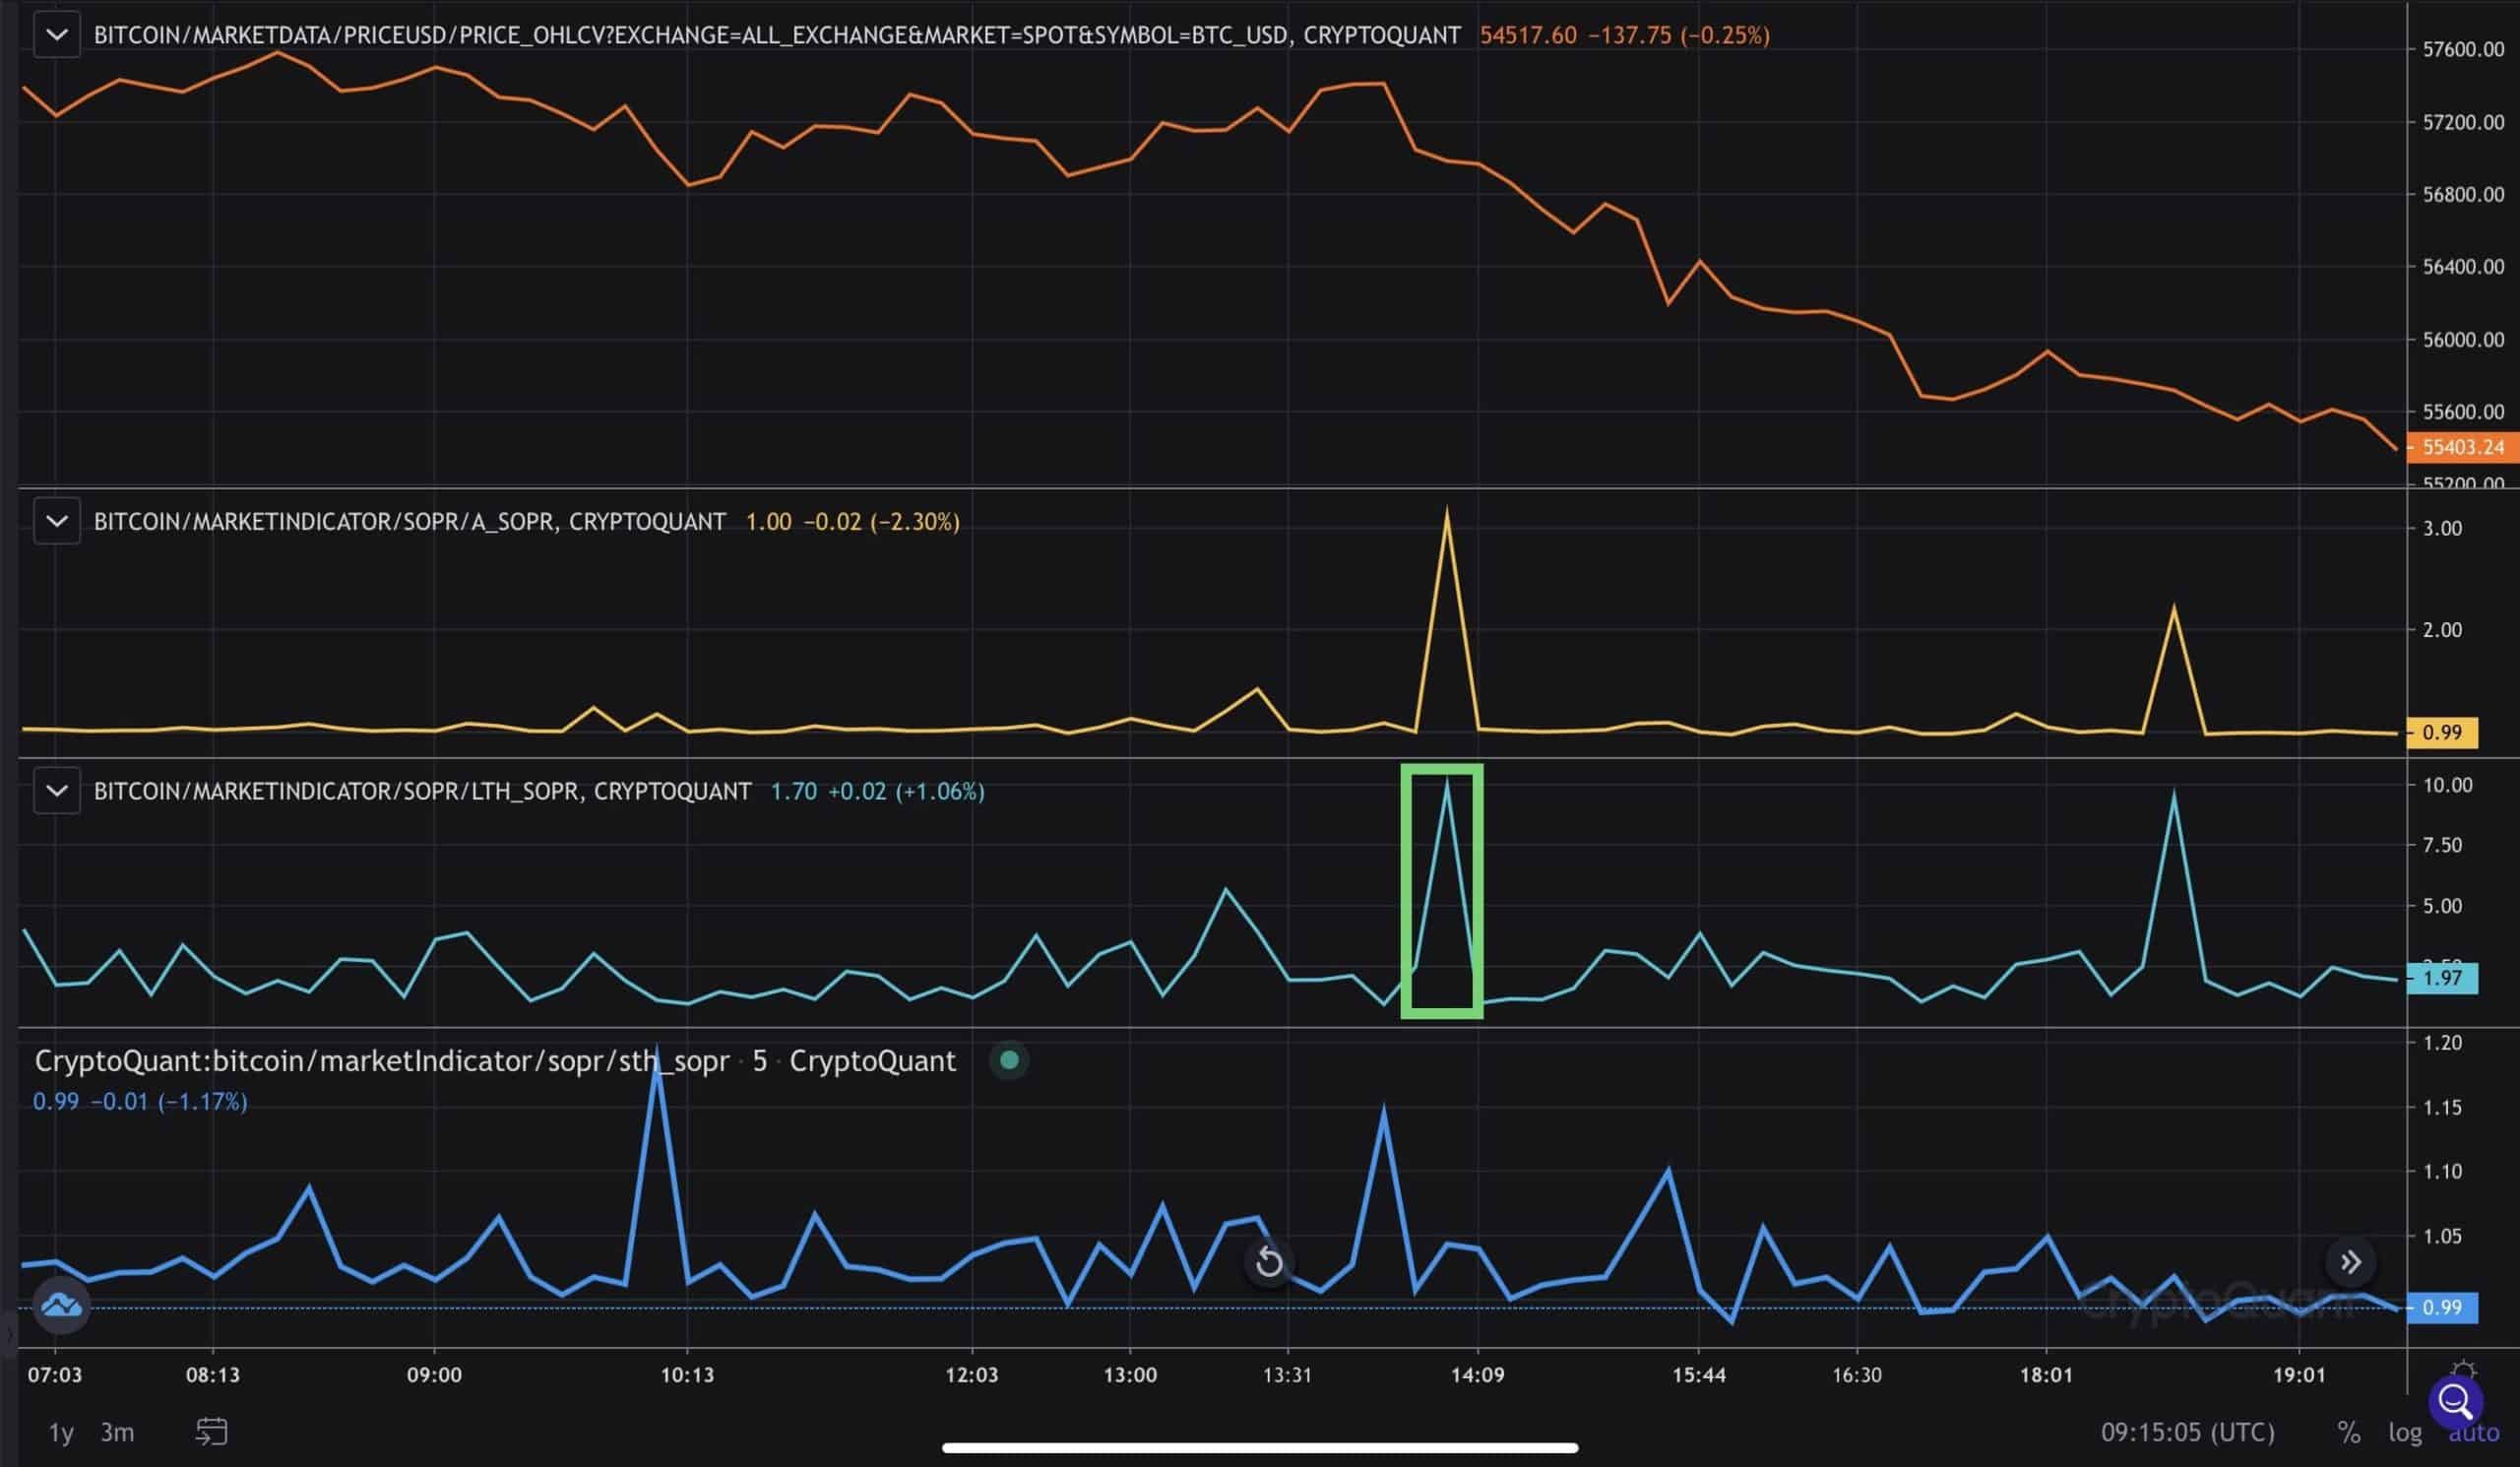
Considering Bitcoin was approaching a significant resistance zone between $55k to $58.3k with elevated open interest and funding rates, the near-term risk of a pullback began to increase.
As Bitcoin formed a local high at $57.8k, on-chain metrics began to show signs of light distribution from older coins, specifically the 3 to 5-year-old cohort according to the UTXO Age Distribution metric by CryptoQuant. This corresponded with a slight uptick in the Coin Days Destroyed Metric (increases when coins are spent after being held) along with an uptick in the LTH SOPR.
The uptick in CDD is nowhere close to the aggressive distribution levels we saw in the later part of the 2017 bull market or even the beginning of the 2018 bear market. The current data is showing light distribution, which is expected after large rallies.
This means some long-term holders were taking profits as BTC hit major resistance. At the moment, on-chain metrics are showing slight distribution. It’s important to watch on-chain metrics closely for any signs of aggressive distribution, which would be bearish for BTC.
What’s Next?
At the time of writing, it appears the 3 to 5-year cohort was taking profit while most other cohorts continue to show strong accumulation. As a result, the Mean Coin Age fell slightly, showing no signs of aggressive distribution on-chain.
Historically, aggressive distribution occurs in the later phases of bull markets where the price goes parabolic and especially in post bull market peaks where BTC enters a bull trap. This is when the price recovers from a large move down while long-term holders aggressively sell and take profit while retail FOMO’s back into the market.
Near term, it is important to make sure the bulls protect $50k to $55.3k, which includes previous levels of resistance now support, along with the September high at $52.9k. A bounce off this zone of support with a push back up to $58k is a bullish signal and increases the probability of breakout towards $60k and higher.
With heavy technical and on-chain resistance, it could take some time for supply to be absorbed. Once the supply is exhausted, we can expect Bitcoin to push higher and potentially start retesting all time highs, as there is significantly less resistance above $58k.
Despite light distribution near term, the overall trend in fundamental and on-chain remain firmly bullish as the majority of cohorts remain in accumulation. The bulls must hold the $50k to $55.3k support zone to help BTC form a higher low and continue the technical breakout. Many fundamental catalysts such as an anticipated BTC futures-backed ETF, public company announcements, the potential risk-on trade resuming can be seen as major tailwinds that can push BTC above all-time highs.


