Bitcoin Price Analysis: BTC Dropped 13% From ATH, Is Bullish Sentiment Intact?
Bitcoin’s price went through a lot in the past few days. Last Wednesday, exactly a week ago, the cryptocurrency painted a fresh all-time high at roughly $67K (on Bitstamp).
Now, BTC is trading at around $59K, having dipped to as low as $58K for a 13% decline since its peak. With this, it’s important to examine what caused the correction and if the bullish sentiment remains intact. The below summarizes what happened today, its cause, and what can be expected based on the Twitter entry of prominent Bitcoin analyst – Daniel Joe.
What Caused Bitcoin’s Price to Correct?
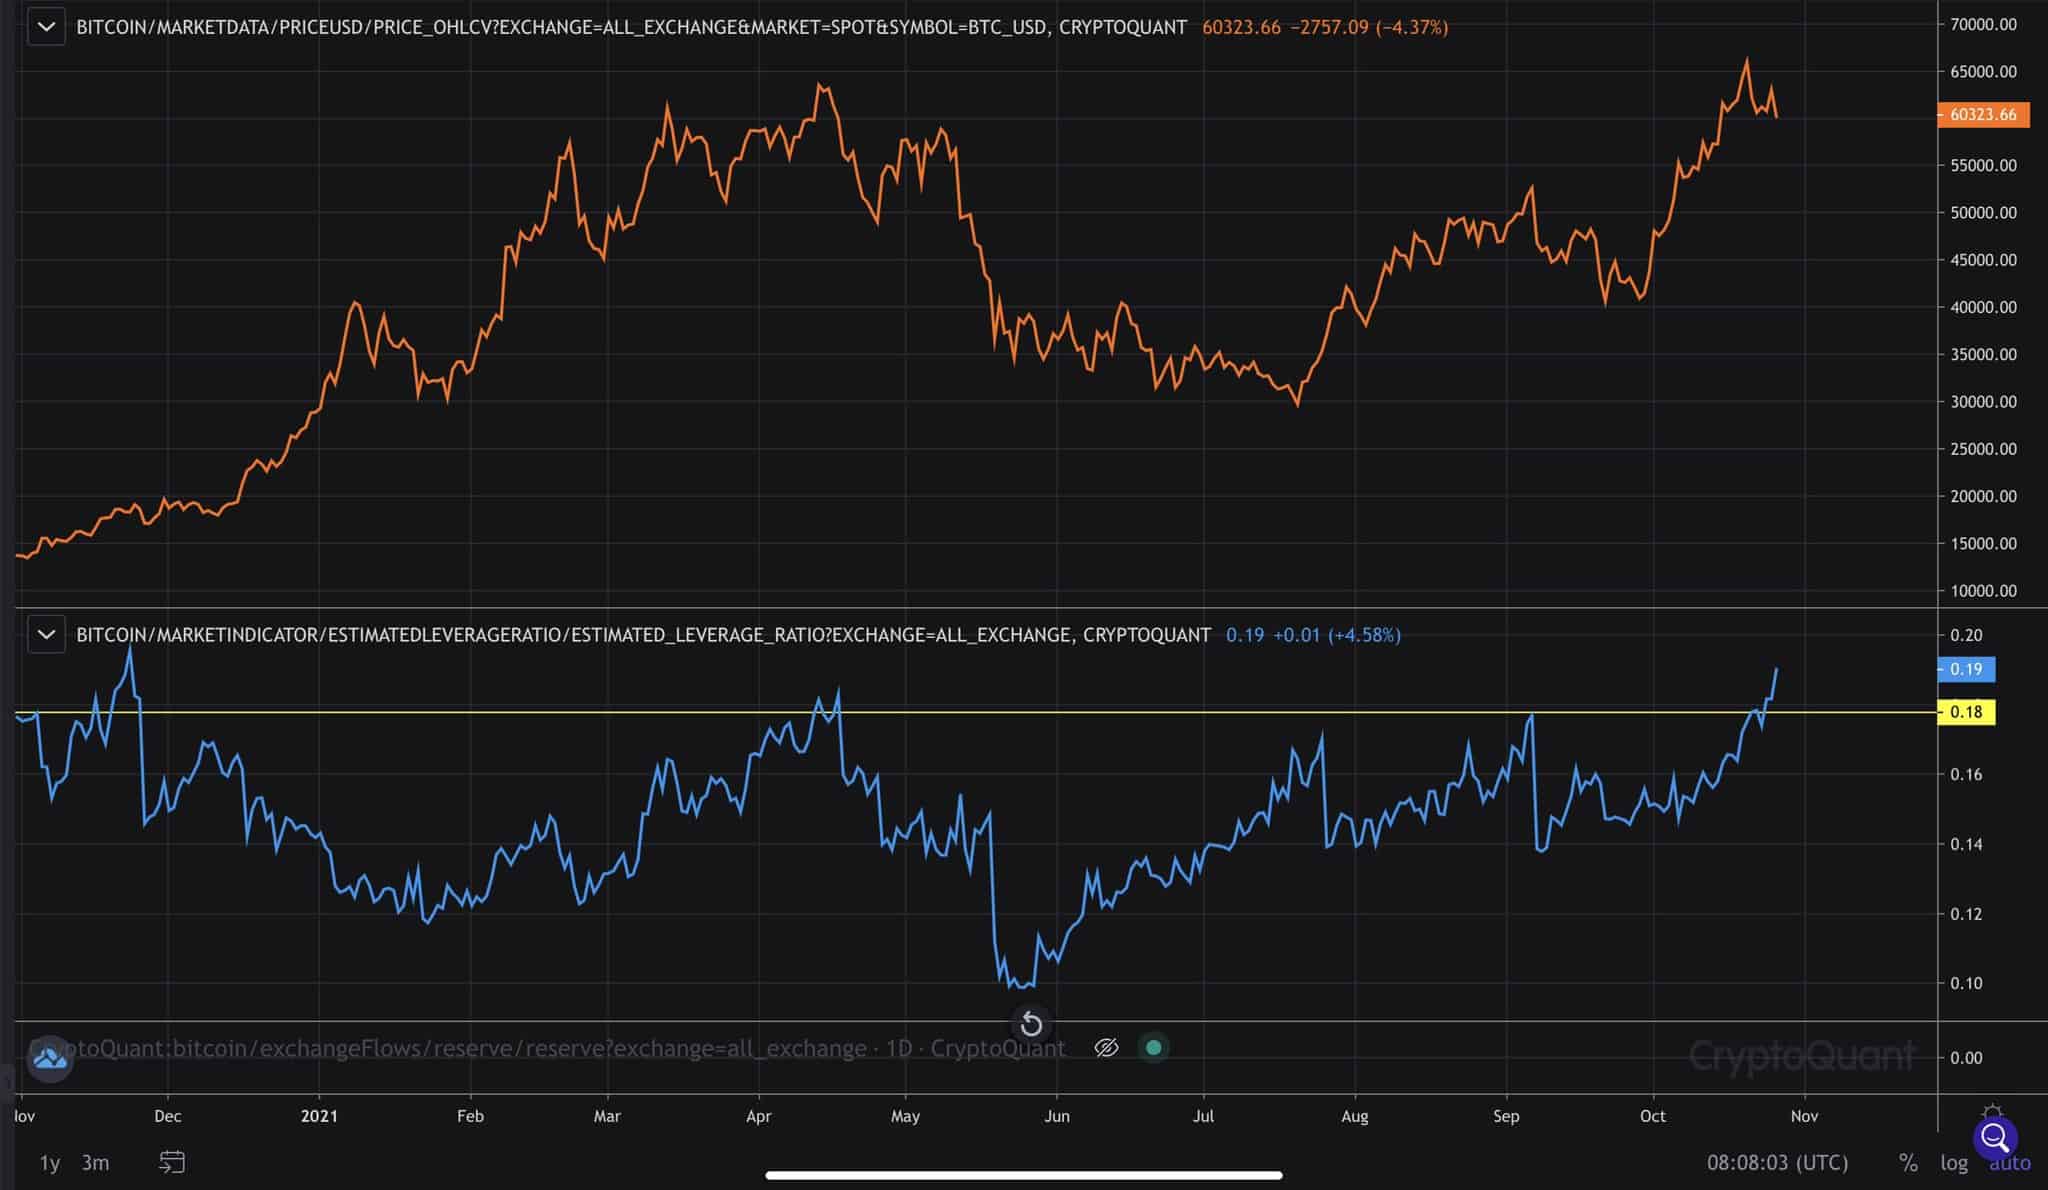
As Daniel repeatedly mentioned here at CryptoPotato over the past few days, the BTC price has been quite overleveraged. Just yesterday, we outlined that the current market structure in terms of the average leverage ratio looks a lot like the one from back in November 2020.
The price back then dropped by 16% after the leverage ratio peaked at .20. Yesterday, the metric was sitting at .19 – a clear sign that the market is getting overconfident and might be due for a flush-out.
Perhaps somewhat expected, the price corrected and dipped below $60K to reach the support at $58.3K, which, so far, has held up. Of course, it’s important to see a close above it for further confirmation.
We also saw a 1,500 BTC inflow into spot exchanges right before the pullback, and the buy wall at $60K was broken, which caused a cascade of liquidations down to $58.1K – today’s current low as of the time of this writing. In total, a little less than $1 billion in leveraged positions were wiped off.

A Technical Outlook
As mentioned above, bitcoin’s price retraced to the technical support around $58.3K before bouncing to where it currently sits at $59K at the time of this writing. A daily close above $58.3K would be the first positive step towards recovery, and it’s important to watch this level as the most imminent support at the moment. A close above $60K would be even better, validating the support at that level as well.
However, the leverage ratio, even though it dipped a little, remains high, as seen in the below chart:

This means that it’s important to remain cautious as further liquidations might still be in the cards. In case there’s more downside, the levels to consider include $58.3K, $57.1K, $55K, and $53K.
The hourly bullish divergence has also been invalidated as BTC is intraday below $60K, and lower lows are being made. This is why it’s important to reclaim $60K as quickly as possible for the bulls to attempt getting back in the driver’s seat for the short term.
On the other hand, it’s good to see that the funding rates came back to neutral, but vigilance is advised as more liquidations might come.
The events from today failed to damage the overall market structure and Bitcoin’s fundamentals clearly indicate that the long-term remains decisively bullish. This looks like a short-term shakeout with a likely bottom between $58.3k and $53K.


