Bitcoin Price Analysis: BTC Dips to $58K in Anticipation of This Week’s Fed Rate Decission
Bitcoin’s price is still consolidating around the $60K level. Yet, an impulsive move might begin soon.
Technical Analysis
By Edris Derakhshi (TradingRage)
The Daily Chart
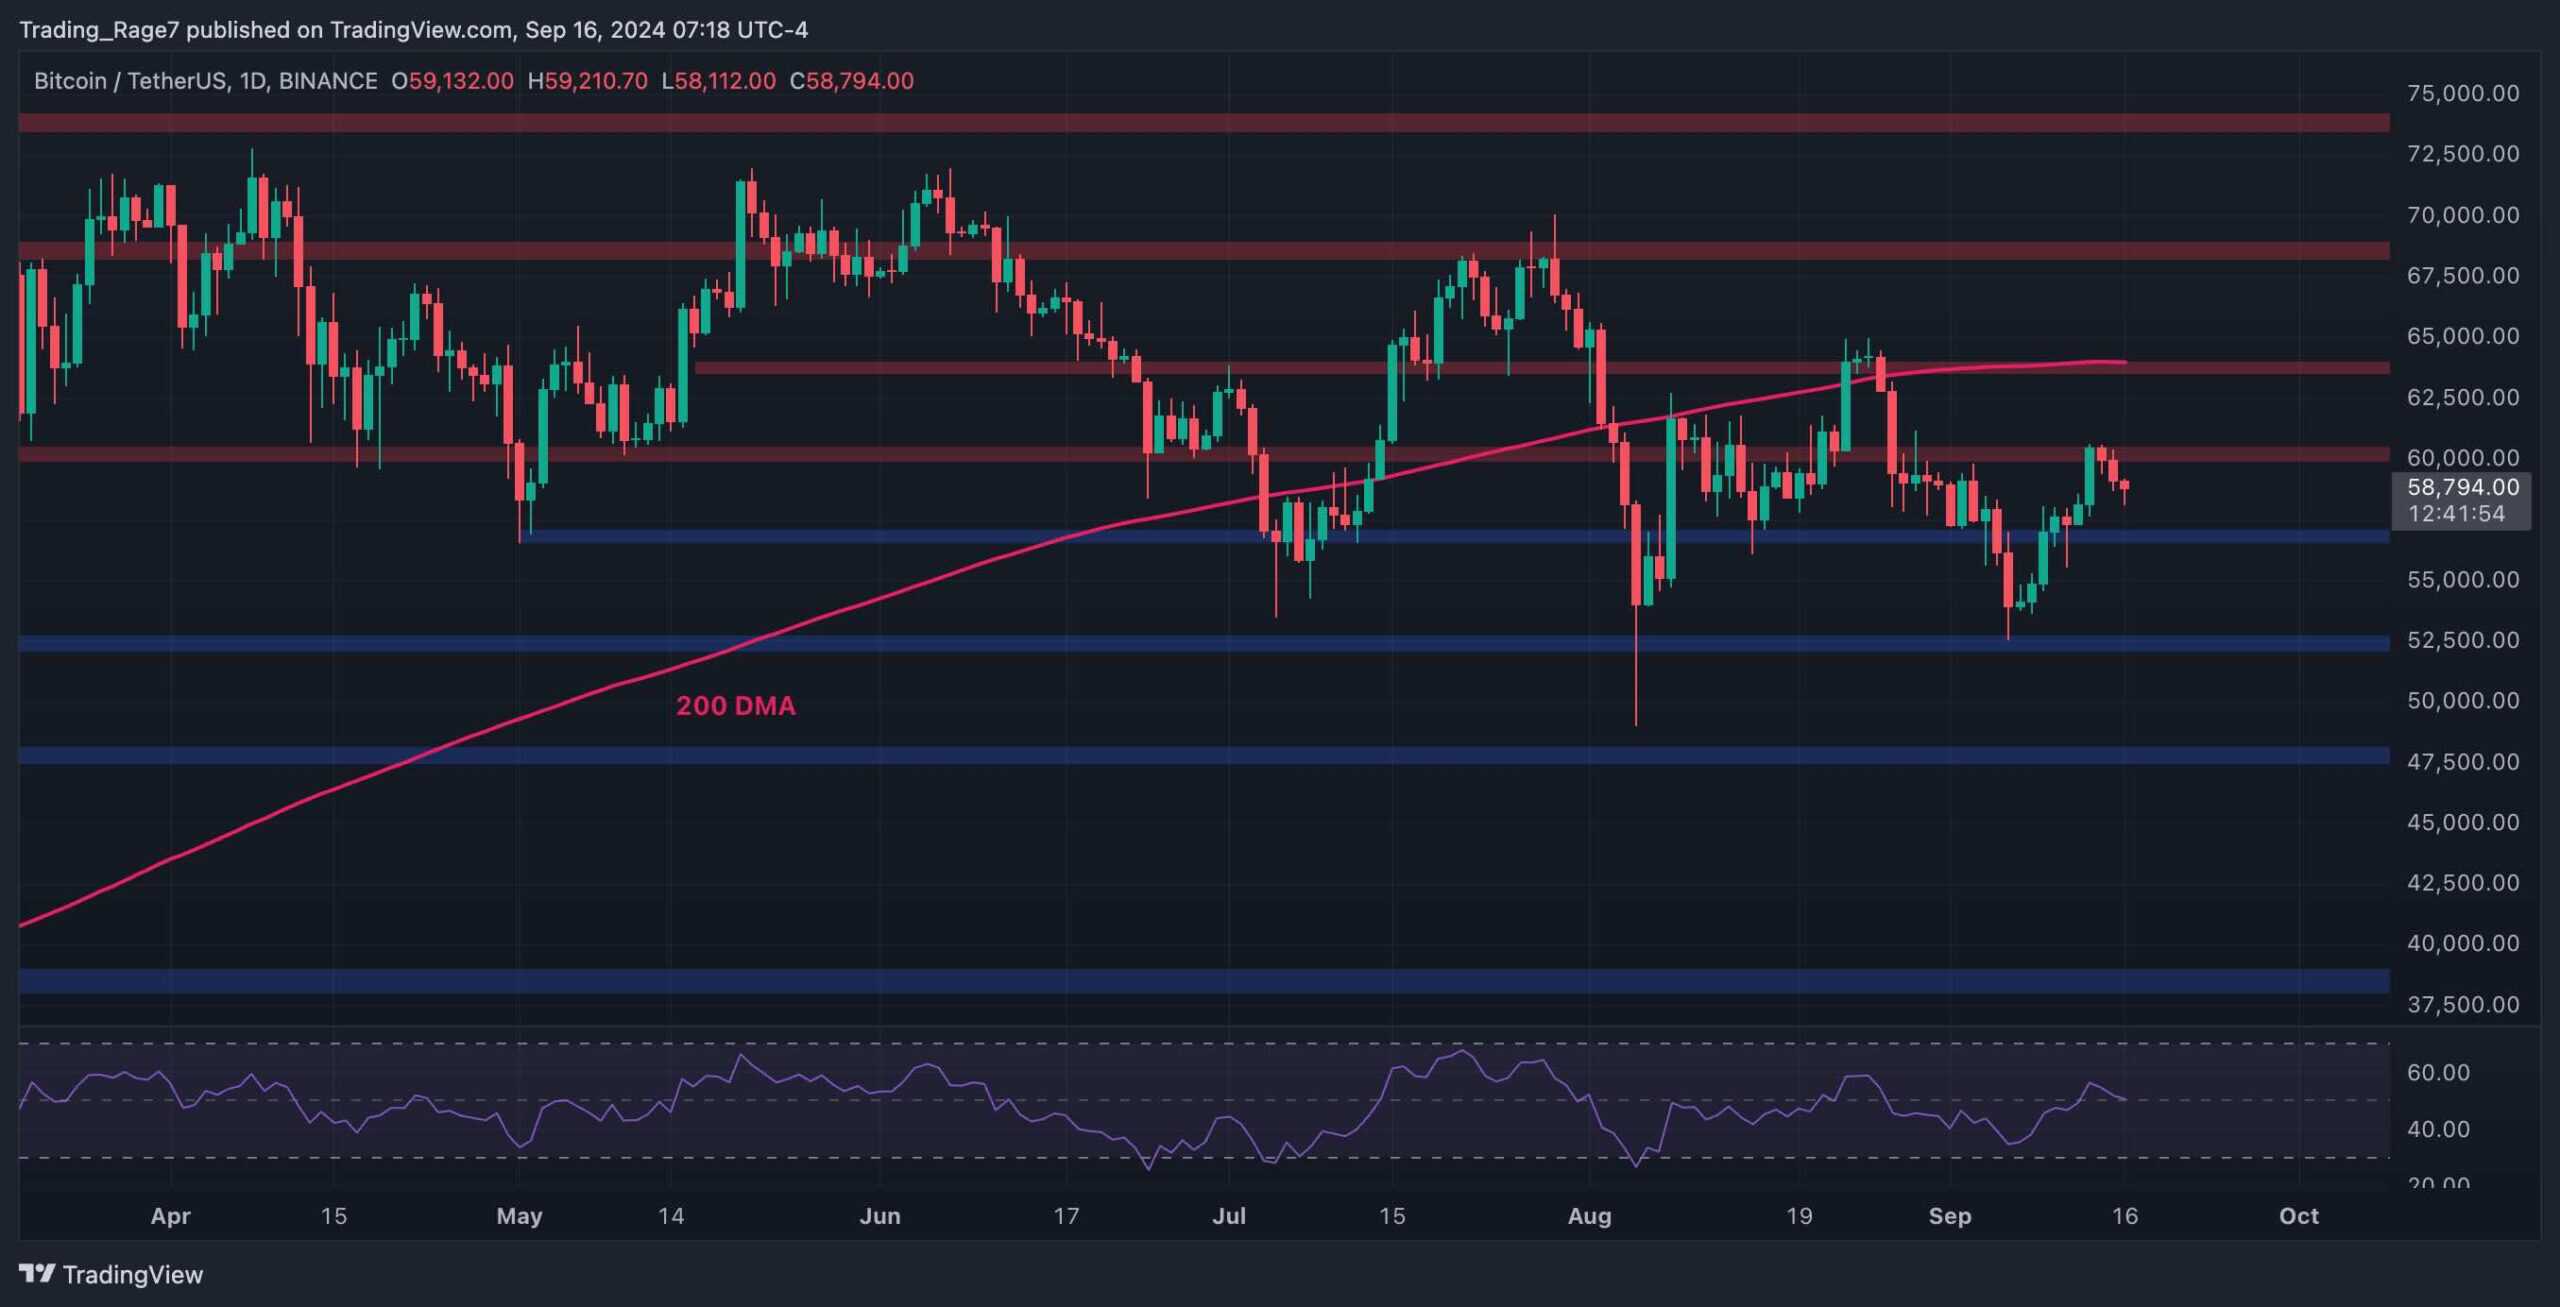
On the daily timeframe, it is evident that the price has yet to climb back and recover definitively above the $60K level after its rapid rejection and drop from the 200-day moving average, located around $63K.
Following the recent rebound from the $52,500 level, the price has once again tested the pivotal range. This is important because for the market to begin a new rally, both $60K and the 200-day moving average should be broken to the upside first.
The 4-Hour Chart
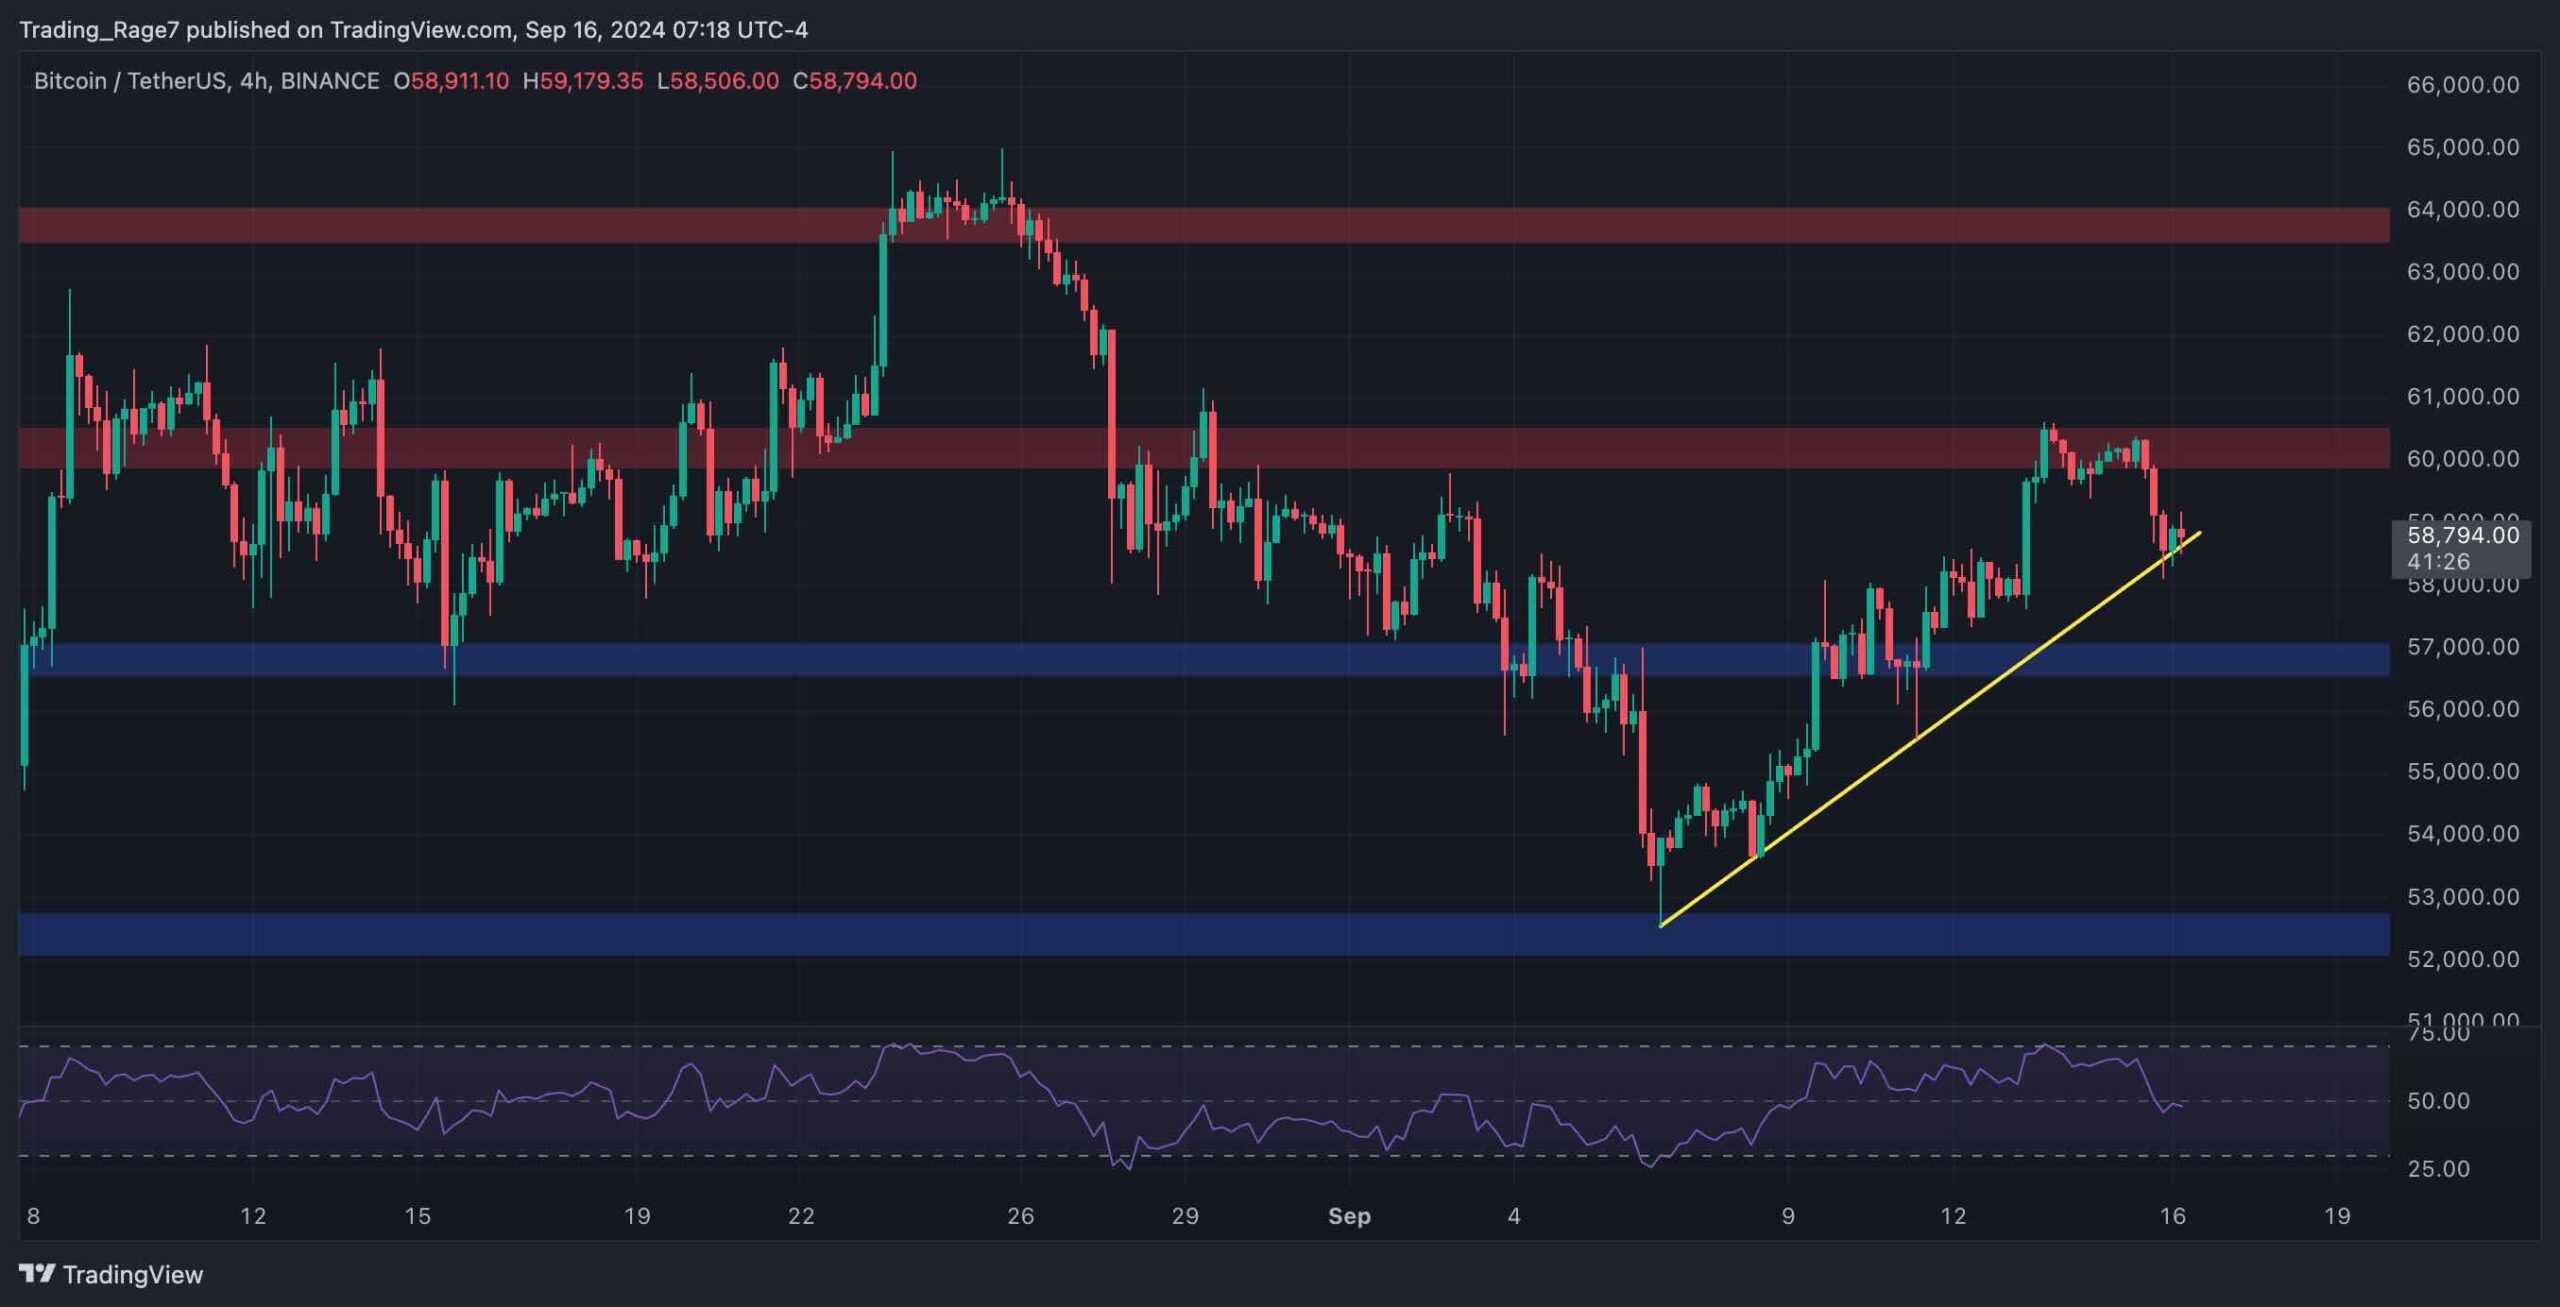
Looking at the 4-hour chart, the price is in a critical area, as it is testing a bullish trendline which has been respected for the last couple of weeks.
If the trendline holds, a rise above the $60K level would be highly probable. However, a breakdown of this range could result in a drop toward $57K and even the $53K area in the coming weeks.
On-Chain Analysis
By Edris Derakhshi (TradingRage)
Bitcoin Funding Rates
The futures market has played a significant role in determining the short-term price action of Bitcoin over the last few years. Therefore, analyzing its sentiment can be highly beneficial.
This chart demonstrates the Bitcoin funding rates metric, which measures whether the buyers or the sellers are more dominant in the futures market. Positive values indicate bullish sentiment, while negative funding rates are associated with fear and bearish sentiment.
As evident on the chart, the rates have decreased significantly during the recent price consolidation and correction, as many futures traders have either been liquidated or shifted their views on the market and are now on the sell side.
While this is a clear bearish sentiment signal, it can also mean that the market is no longer overheated, and with sufficient spot buying pressure, a sustainable rally can begin soon.

The post Bitcoin Price Analysis: BTC Dips to $58K in Anticipation of This Week’s Fed Rate Decission appeared first on CryptoPotato.


