Bitcoin Price Analysis: BTC Crashes 10% Weekly, Where’s the Potential Bottom?
Bitcoin’s price has recently been rejected from a significant resistance area and is beginning to show characteristics of a bearish reversal. However, several support levels are still available that can push the cryptocurrency back higher.
Technical Analysis
By TradingRage
Bitcoin Price Analysis: The Daily Chart
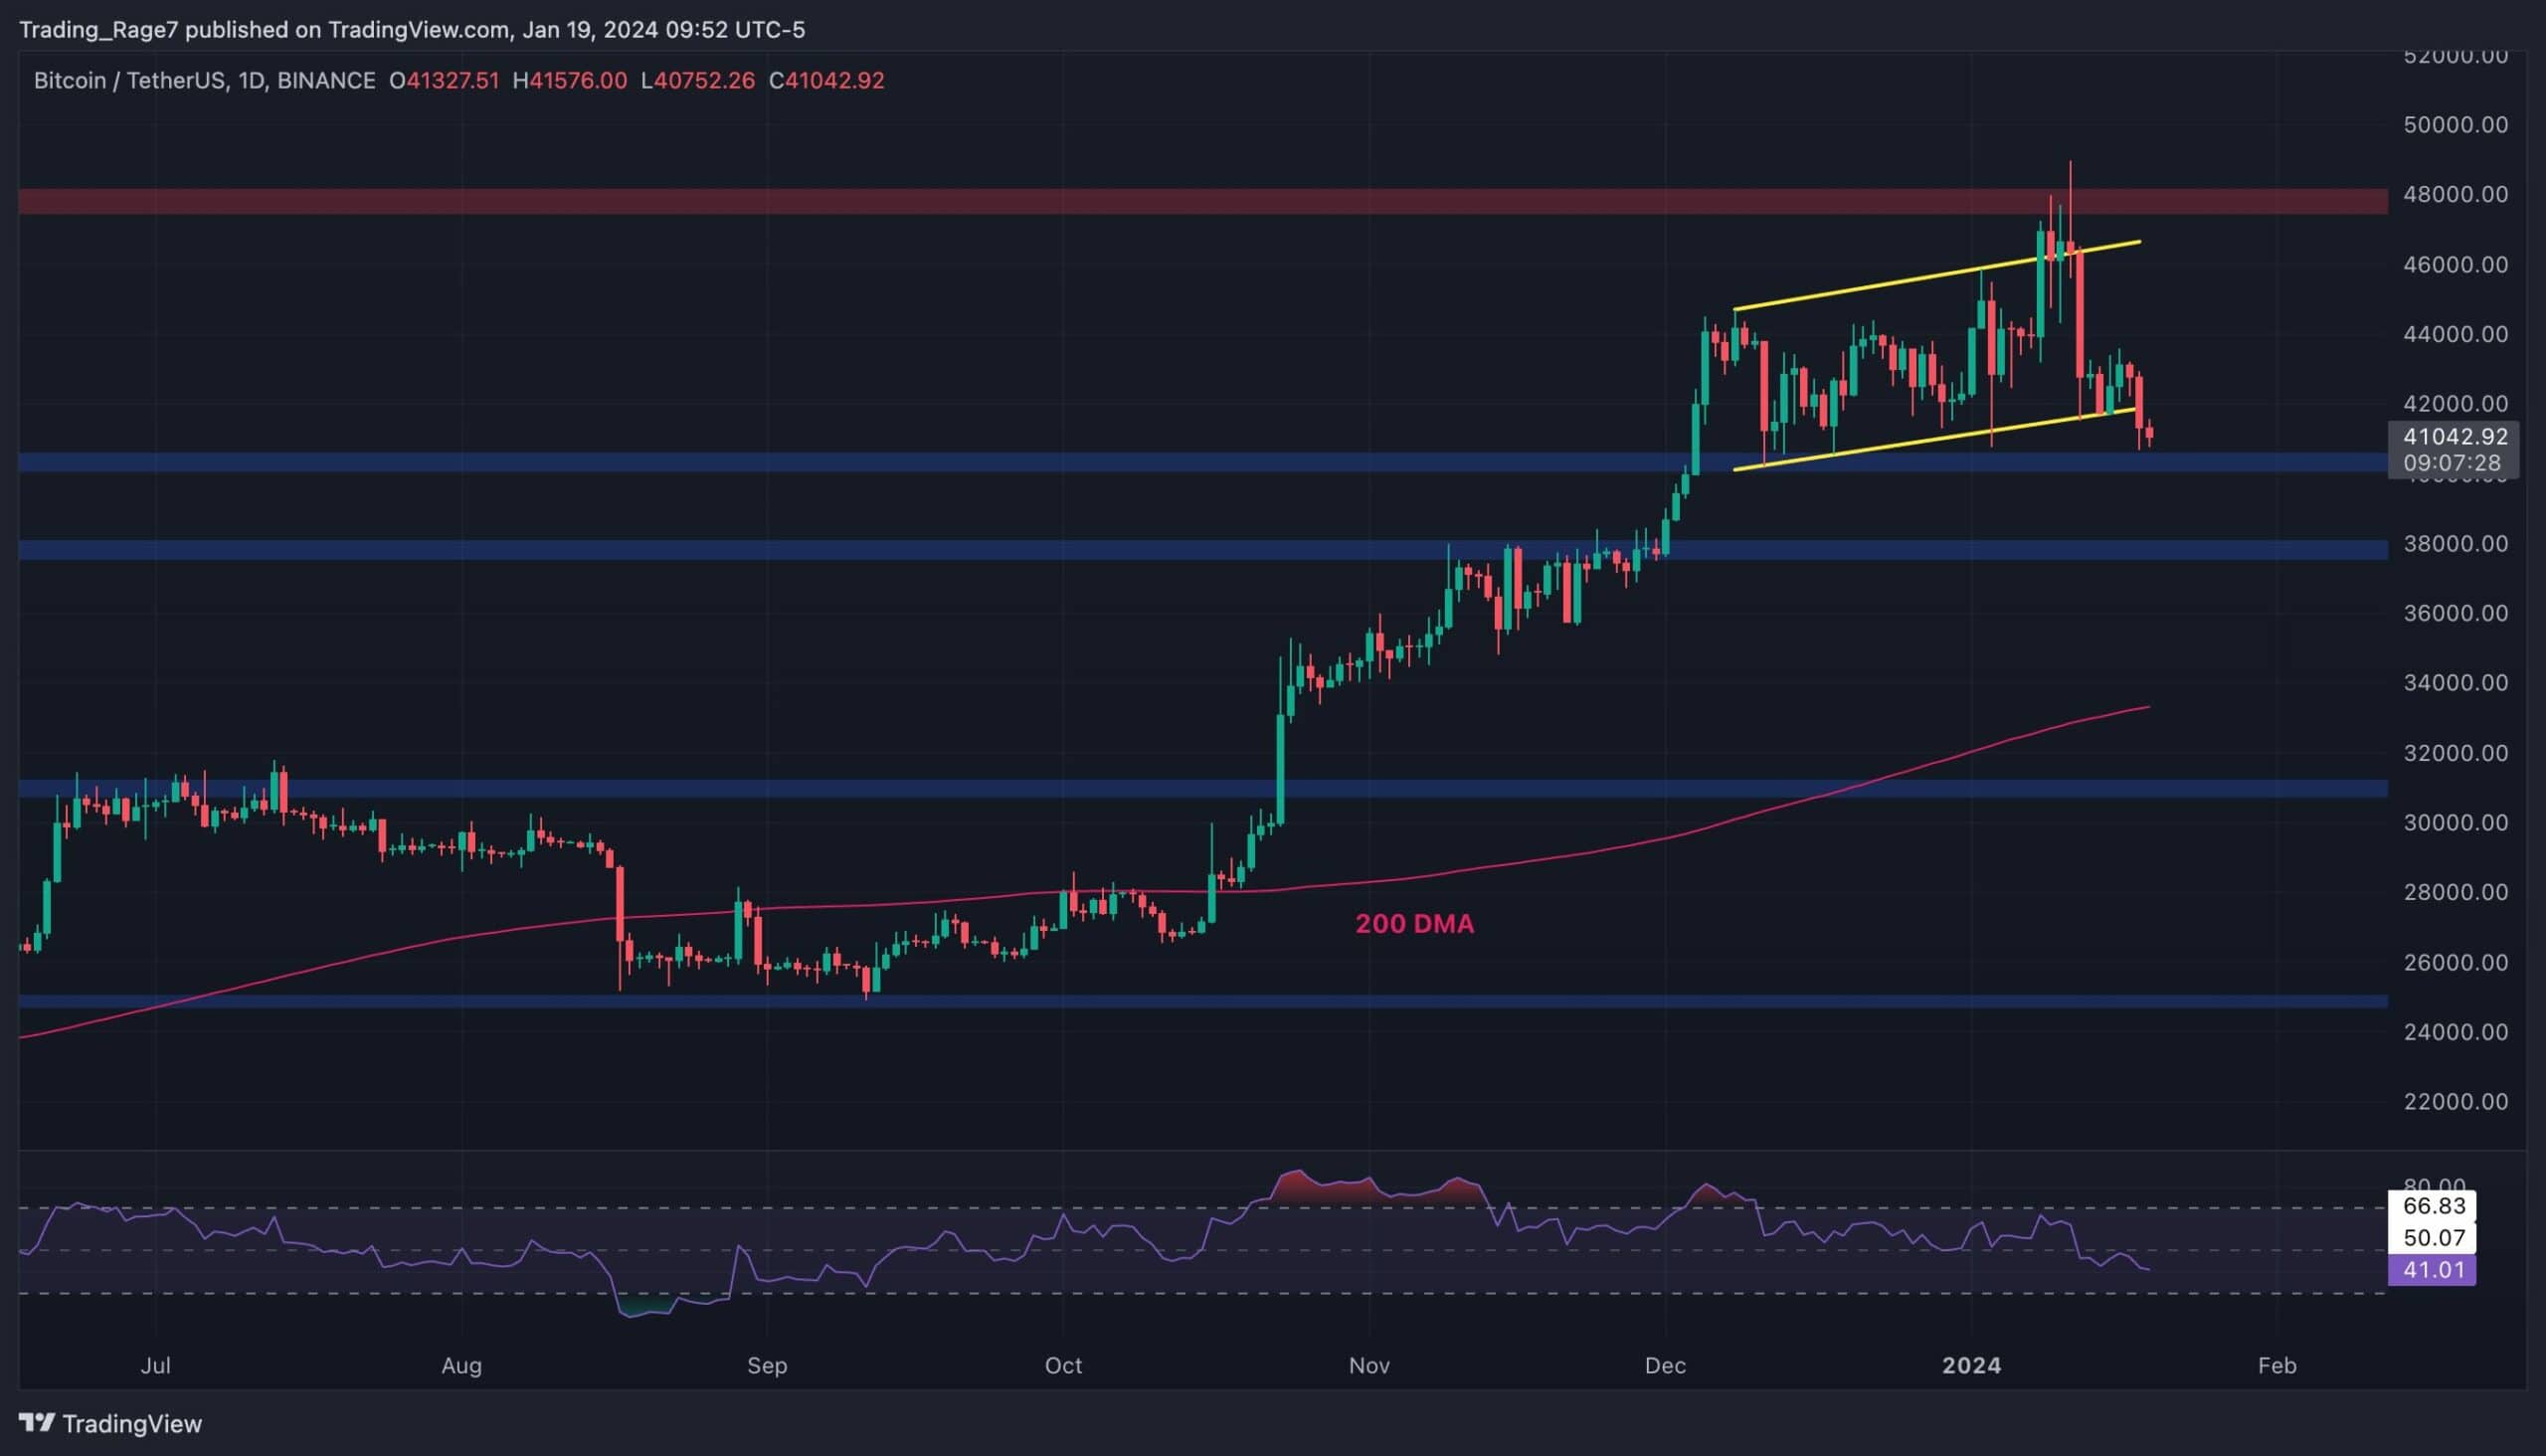
On the daily timeframe, the price has been forming a large ascending channel below the $48K level. Following a rejection from the $48K resistance zone last week, the market has begun falling rapidly. The channel has been broken to the downside, and the price is approaching the $40K support zone.
In case this level fails to hold, $38K and the 200-day moving average, located around the $34K mark, will be the potential targets in the coming weeks.

The 4-Hour Chart
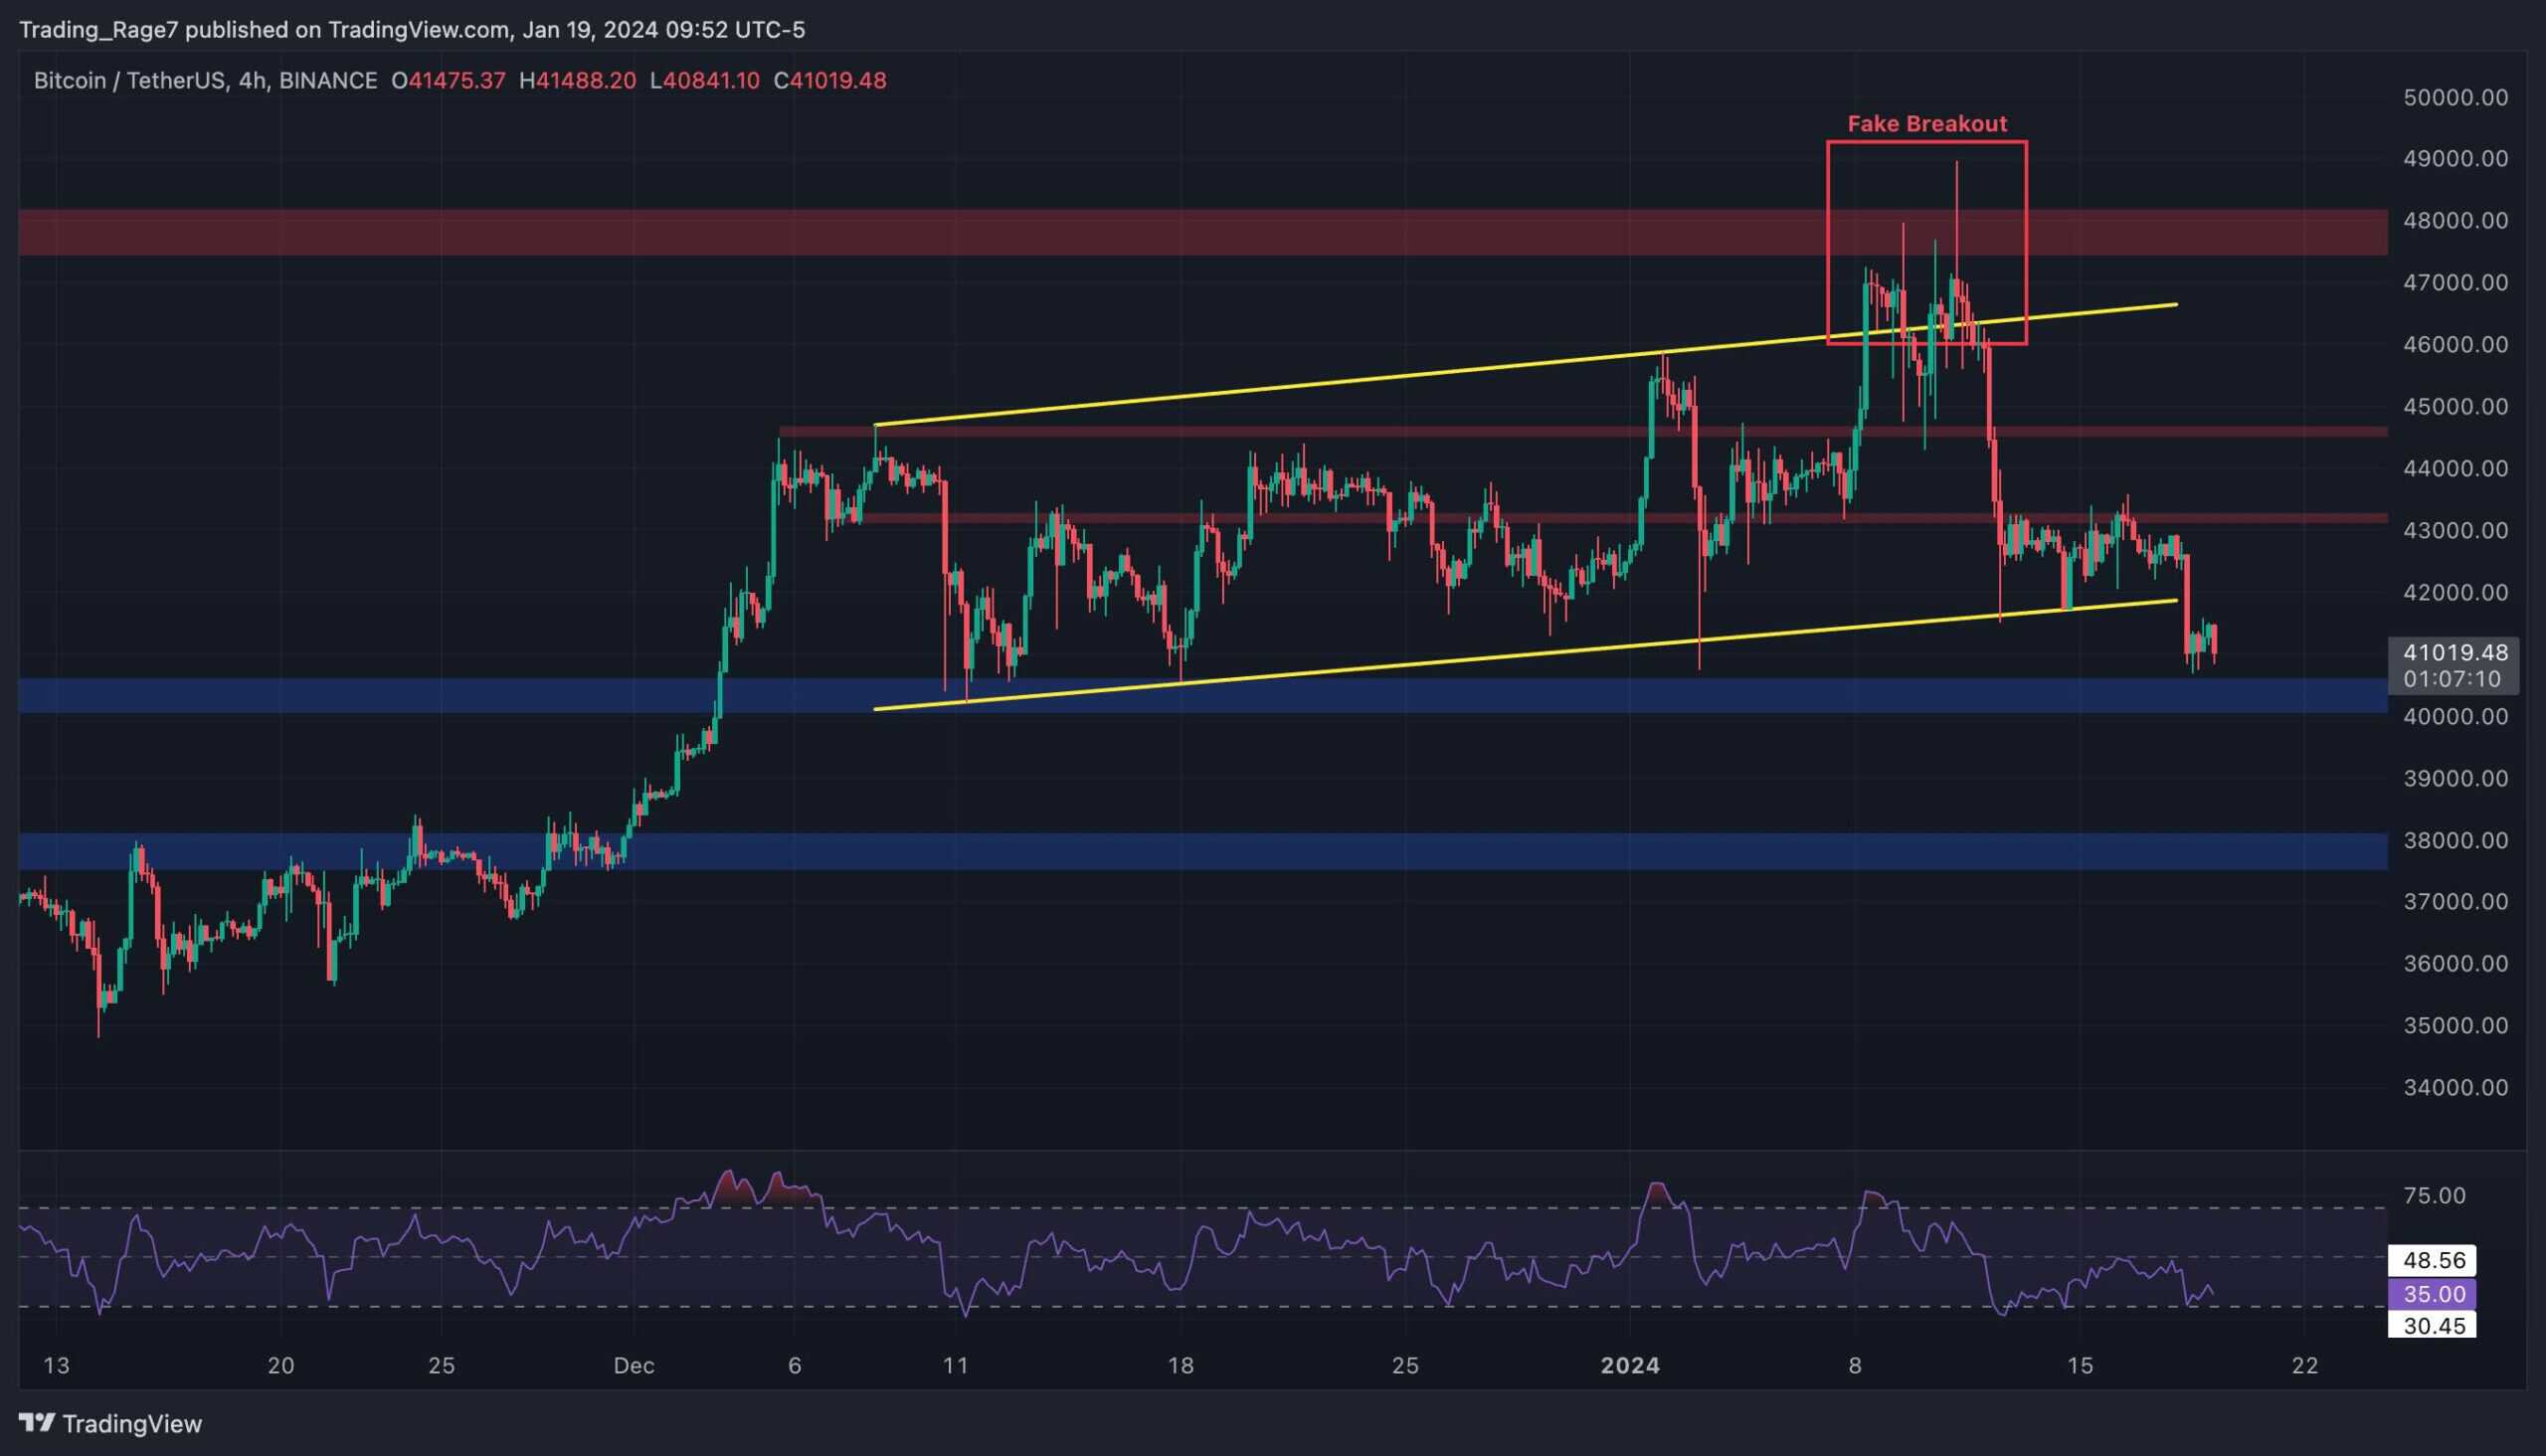
Looking at the 4-hour timeframe, it is evident that the price is currently demonstrating a bearish trend by making lower highs and lows. The channel has also been broken to the downside with momentum.
The relative strength index is also showing values below 50%, indicating that the momentum is in favor of the sellers. As a result, a breakdown of the $40K support level seems probable.

On-Chain Analysis
By TradingRage
Miner Reserve
When it comes to Bitcoin’s network, there are no participants more influential than the miners. In addition to providing security and processing transactions, miners also hold massive amounts of BTC in their wallets. Therefore, analyzing their behavior could give us clues in the direction.
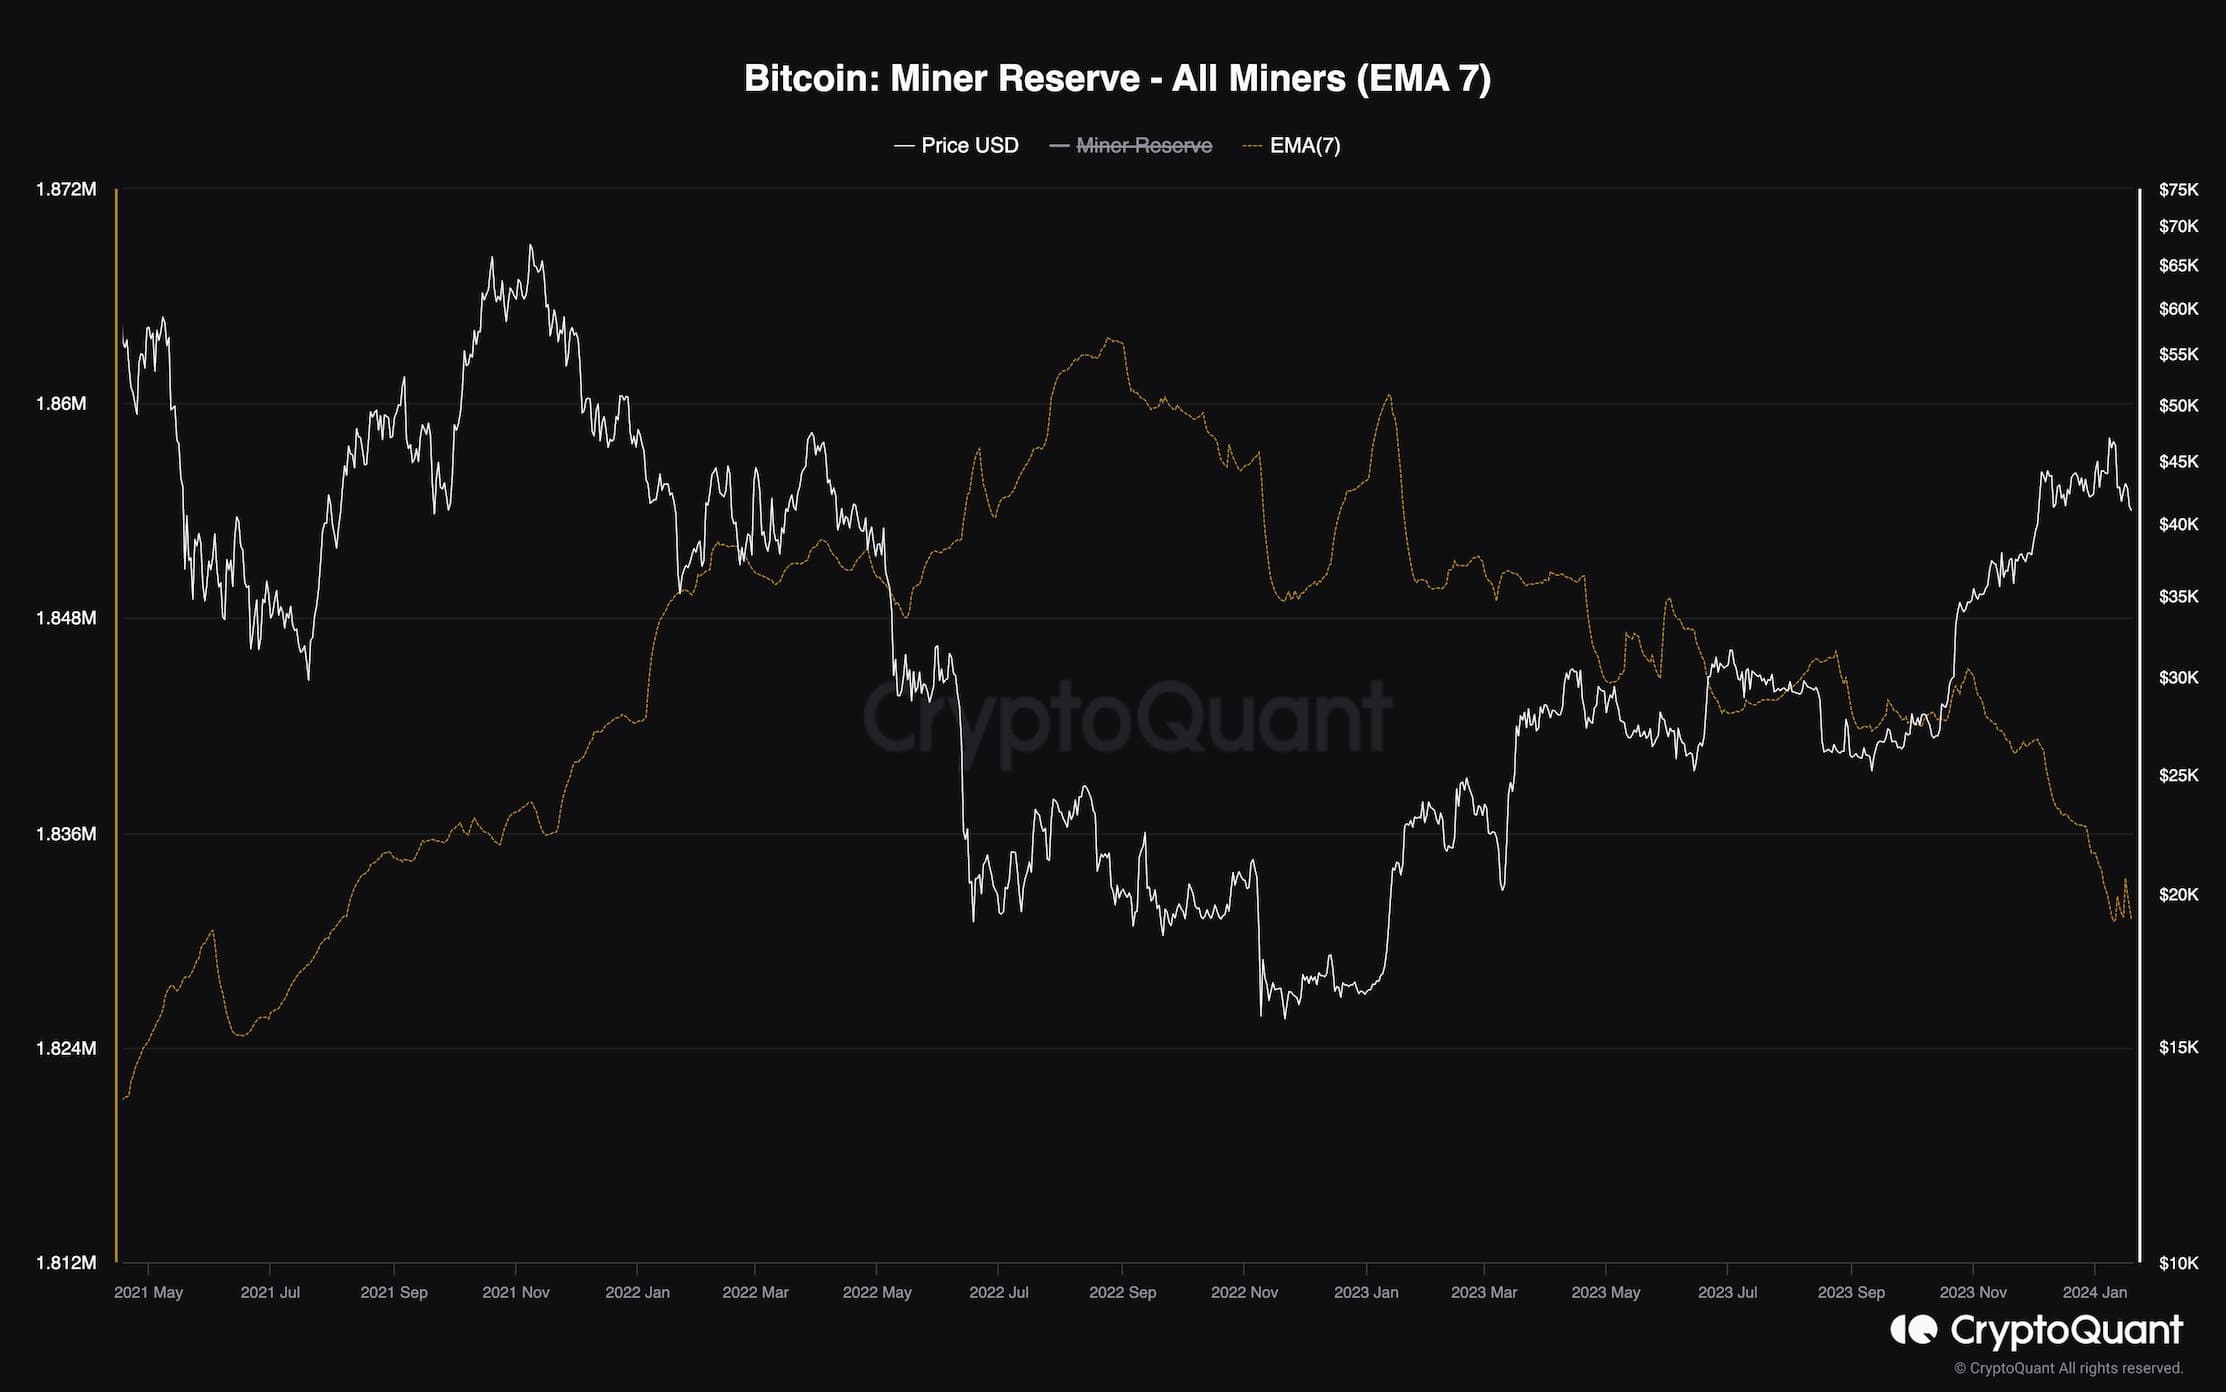
This chart depicts the miner reserve metric, which measures the amount of BTC that miners hold. Rising values indicate accumulation behavior, while declines show selling by the miners.
As the chart suggests, the miners have been consistently selling their holdings since the beginning of the uptrend. While this is a natural profit realization behavior, the subsequent selling pressure can lead to a bearish reversal if not met with sufficient demand.

The post Bitcoin Price Analysis: BTC Crashes 10% Weekly, Where’s the Potential Bottom? appeared first on CryptoPotato.


