Bitcoin Price Analysis: BTC Continues This Week’s Bearishness, Next Stop $51K?
The short-term bearish momentum for Bitcoin continues, following another 3.5% price decrease today as the cryptocurrency dropped by a total of $2,000 into the $55K zone.
BTC had been performing well last week as it followed a steep ascending price channel and even managed to create a fresh ATH over the weekend at $61,780 (according to Bitstamp). From, there, it started to head lower as it broke beneath the ascending channel on Monday.
The cryptocurrency found support at $54,560 (.382 Fib) on Monday. It did spike further beneath this level yesterday, reaching as low as $53,220, but the daily candle managed to close at $56,950 following a nice reversal.
Today, the 3.5% price drop caused BTC to head back beneath $55,000 as it tested the above-mentioned support at $54,5560 (.382 Fib).
As of now, Bitcoin failed to reclaim the previous mid-February ATH level of $58.5K, along with the bearish divergence on the mid-term, which could be worrying signs for the bulls in the short-term.
BTC Price Support and Resistance Levels to Watch
Key Support Levels: $54,560, $53,220 (this week’s low), $52,340, $51,000, $50,000.
Key Resistance Levels: $56,950, $58,355, $60,000, $61,780, $62,170.
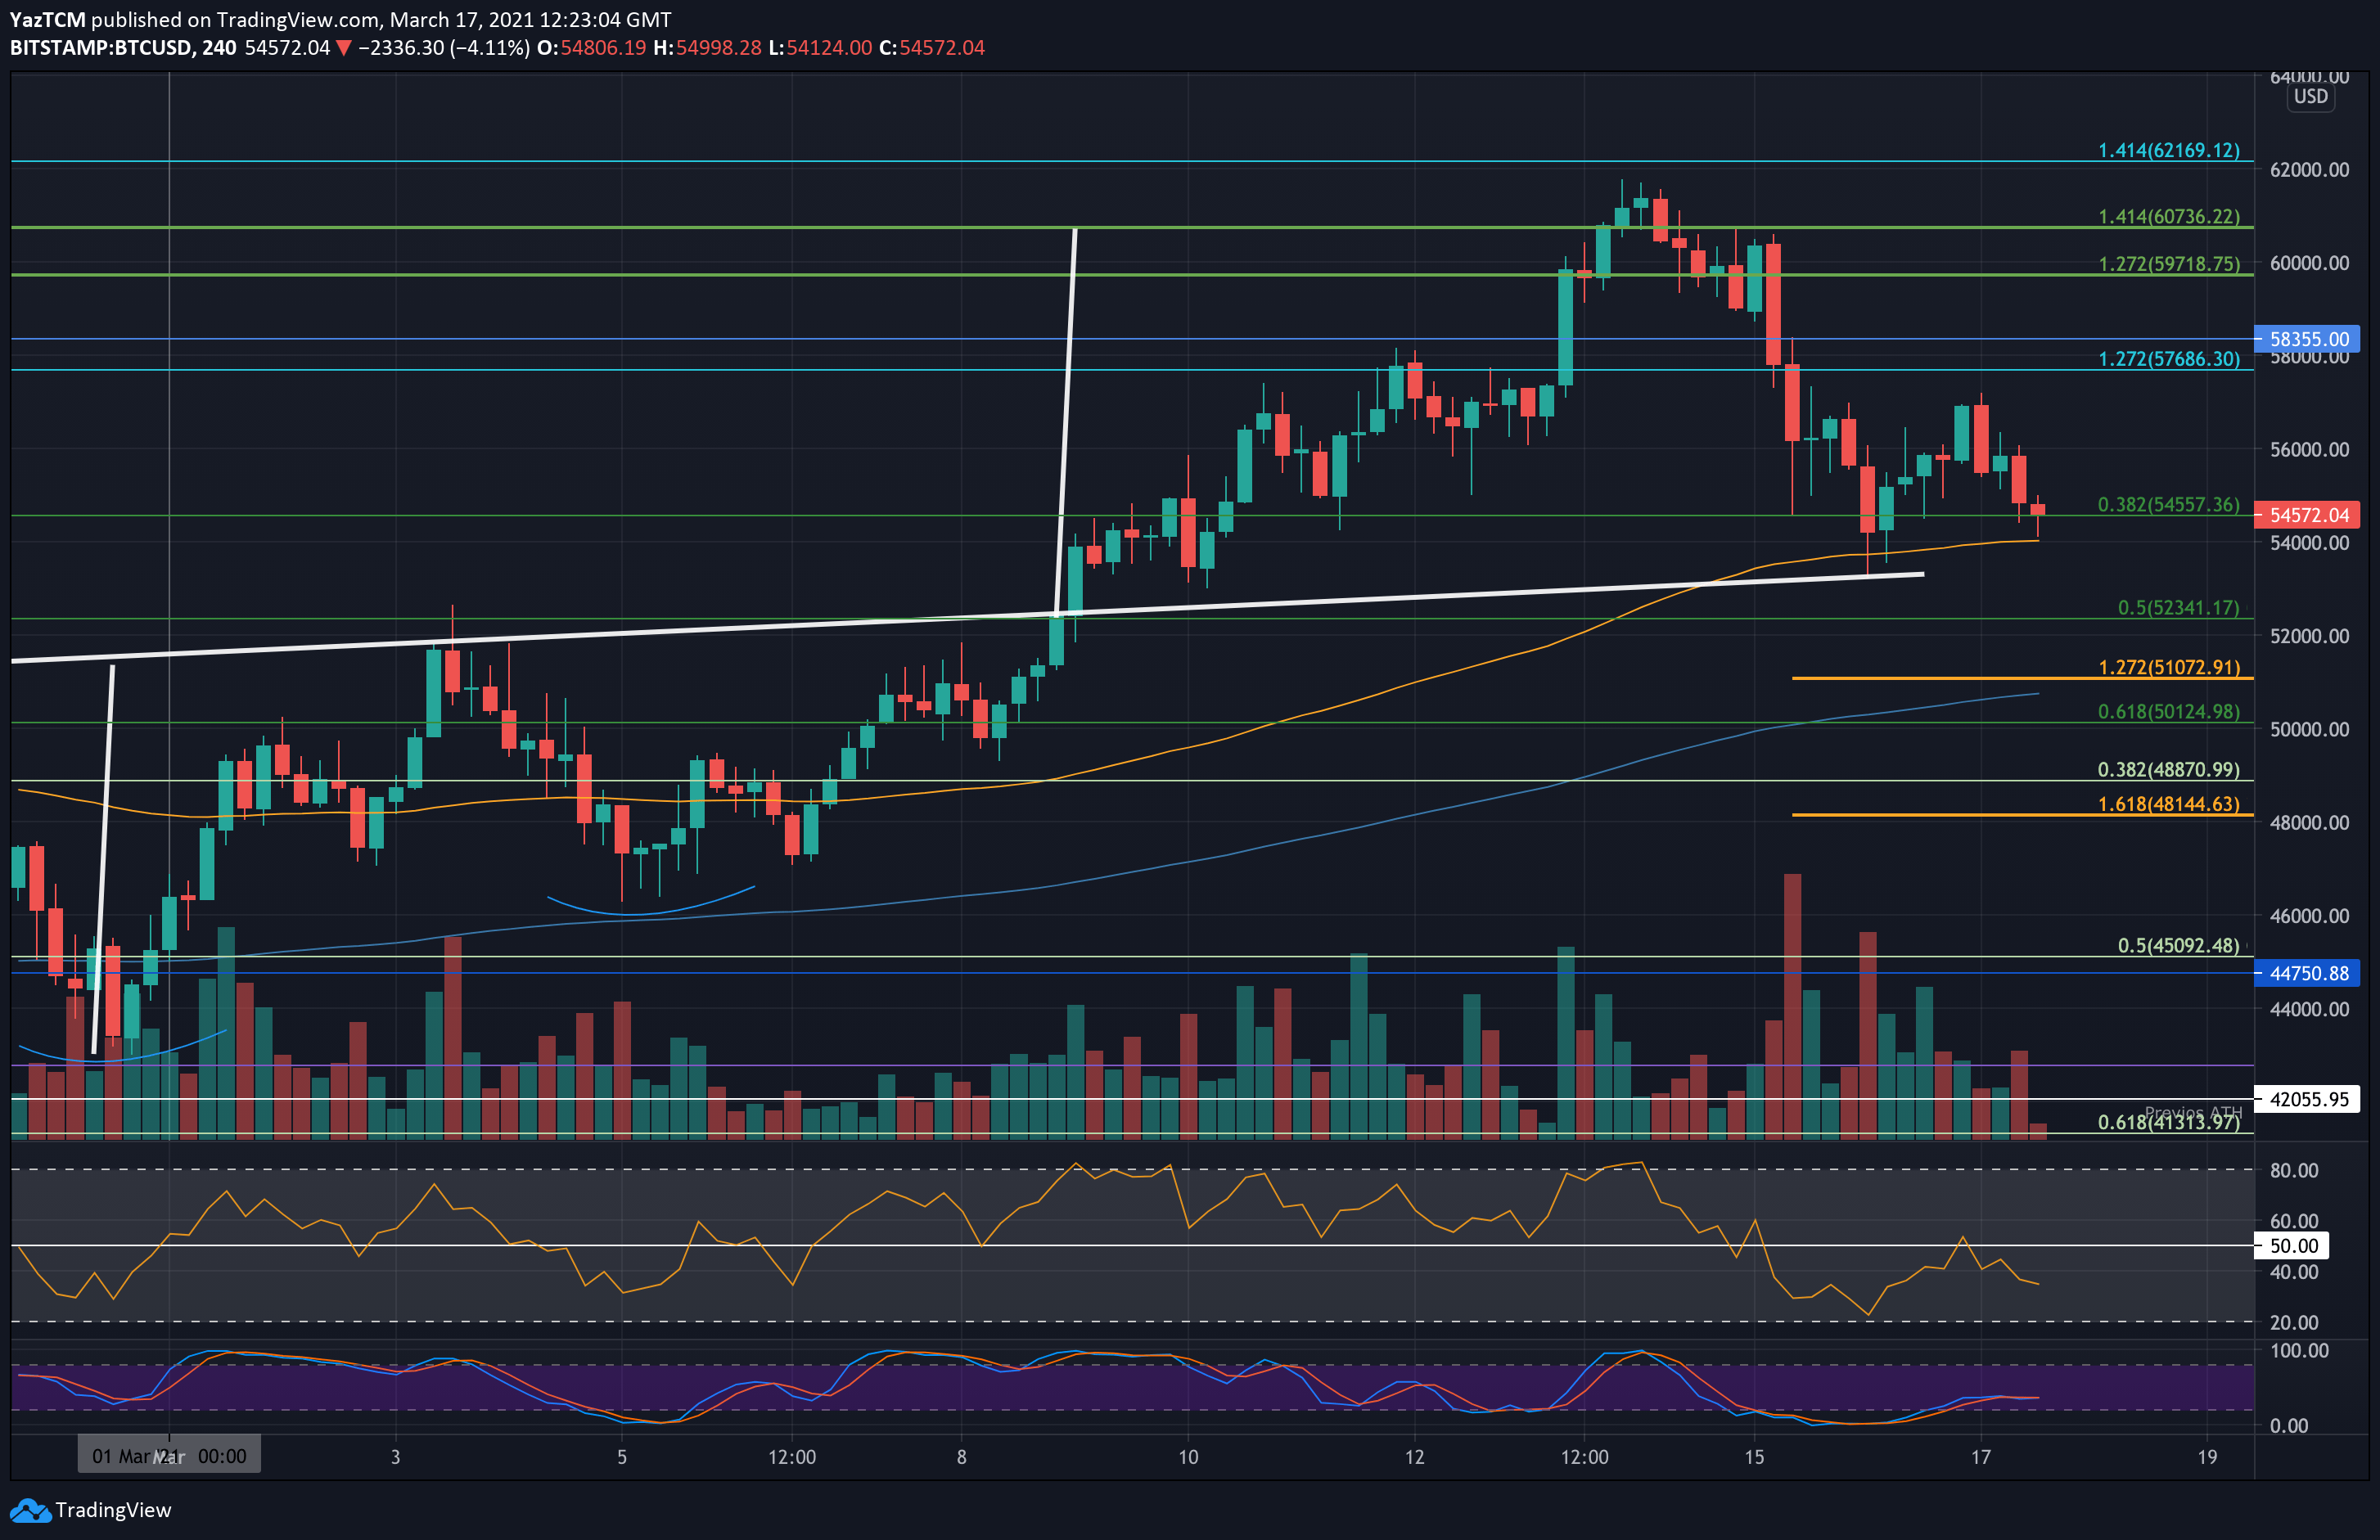
Looking ahead, the first level of support lies directly at $54,560 (.382 Fib). This is followed by support at $53,220 (yesterday’s low), $52,340 (.5 Fib), $51,000 (downside 1.272 Fib Extension) and $50,000 (.618 Fib).
On the other side, the firs strong resistance lies at yesterday’s high, around $56,950. Above this, resistance lies at $58,355 (previous ATH), $60,000, and $61,780 (current ATH). Additional resistance lies at $62,170 (1.414 Fib Extension) and $65,000.
The RSI has returned to the midline and is starting to poke beneath it, indicating the bears are trying to gain control of the market momentum. If it continues beneath 50, the bearish momentum will increase and cause BTC to head back toward $50,000.
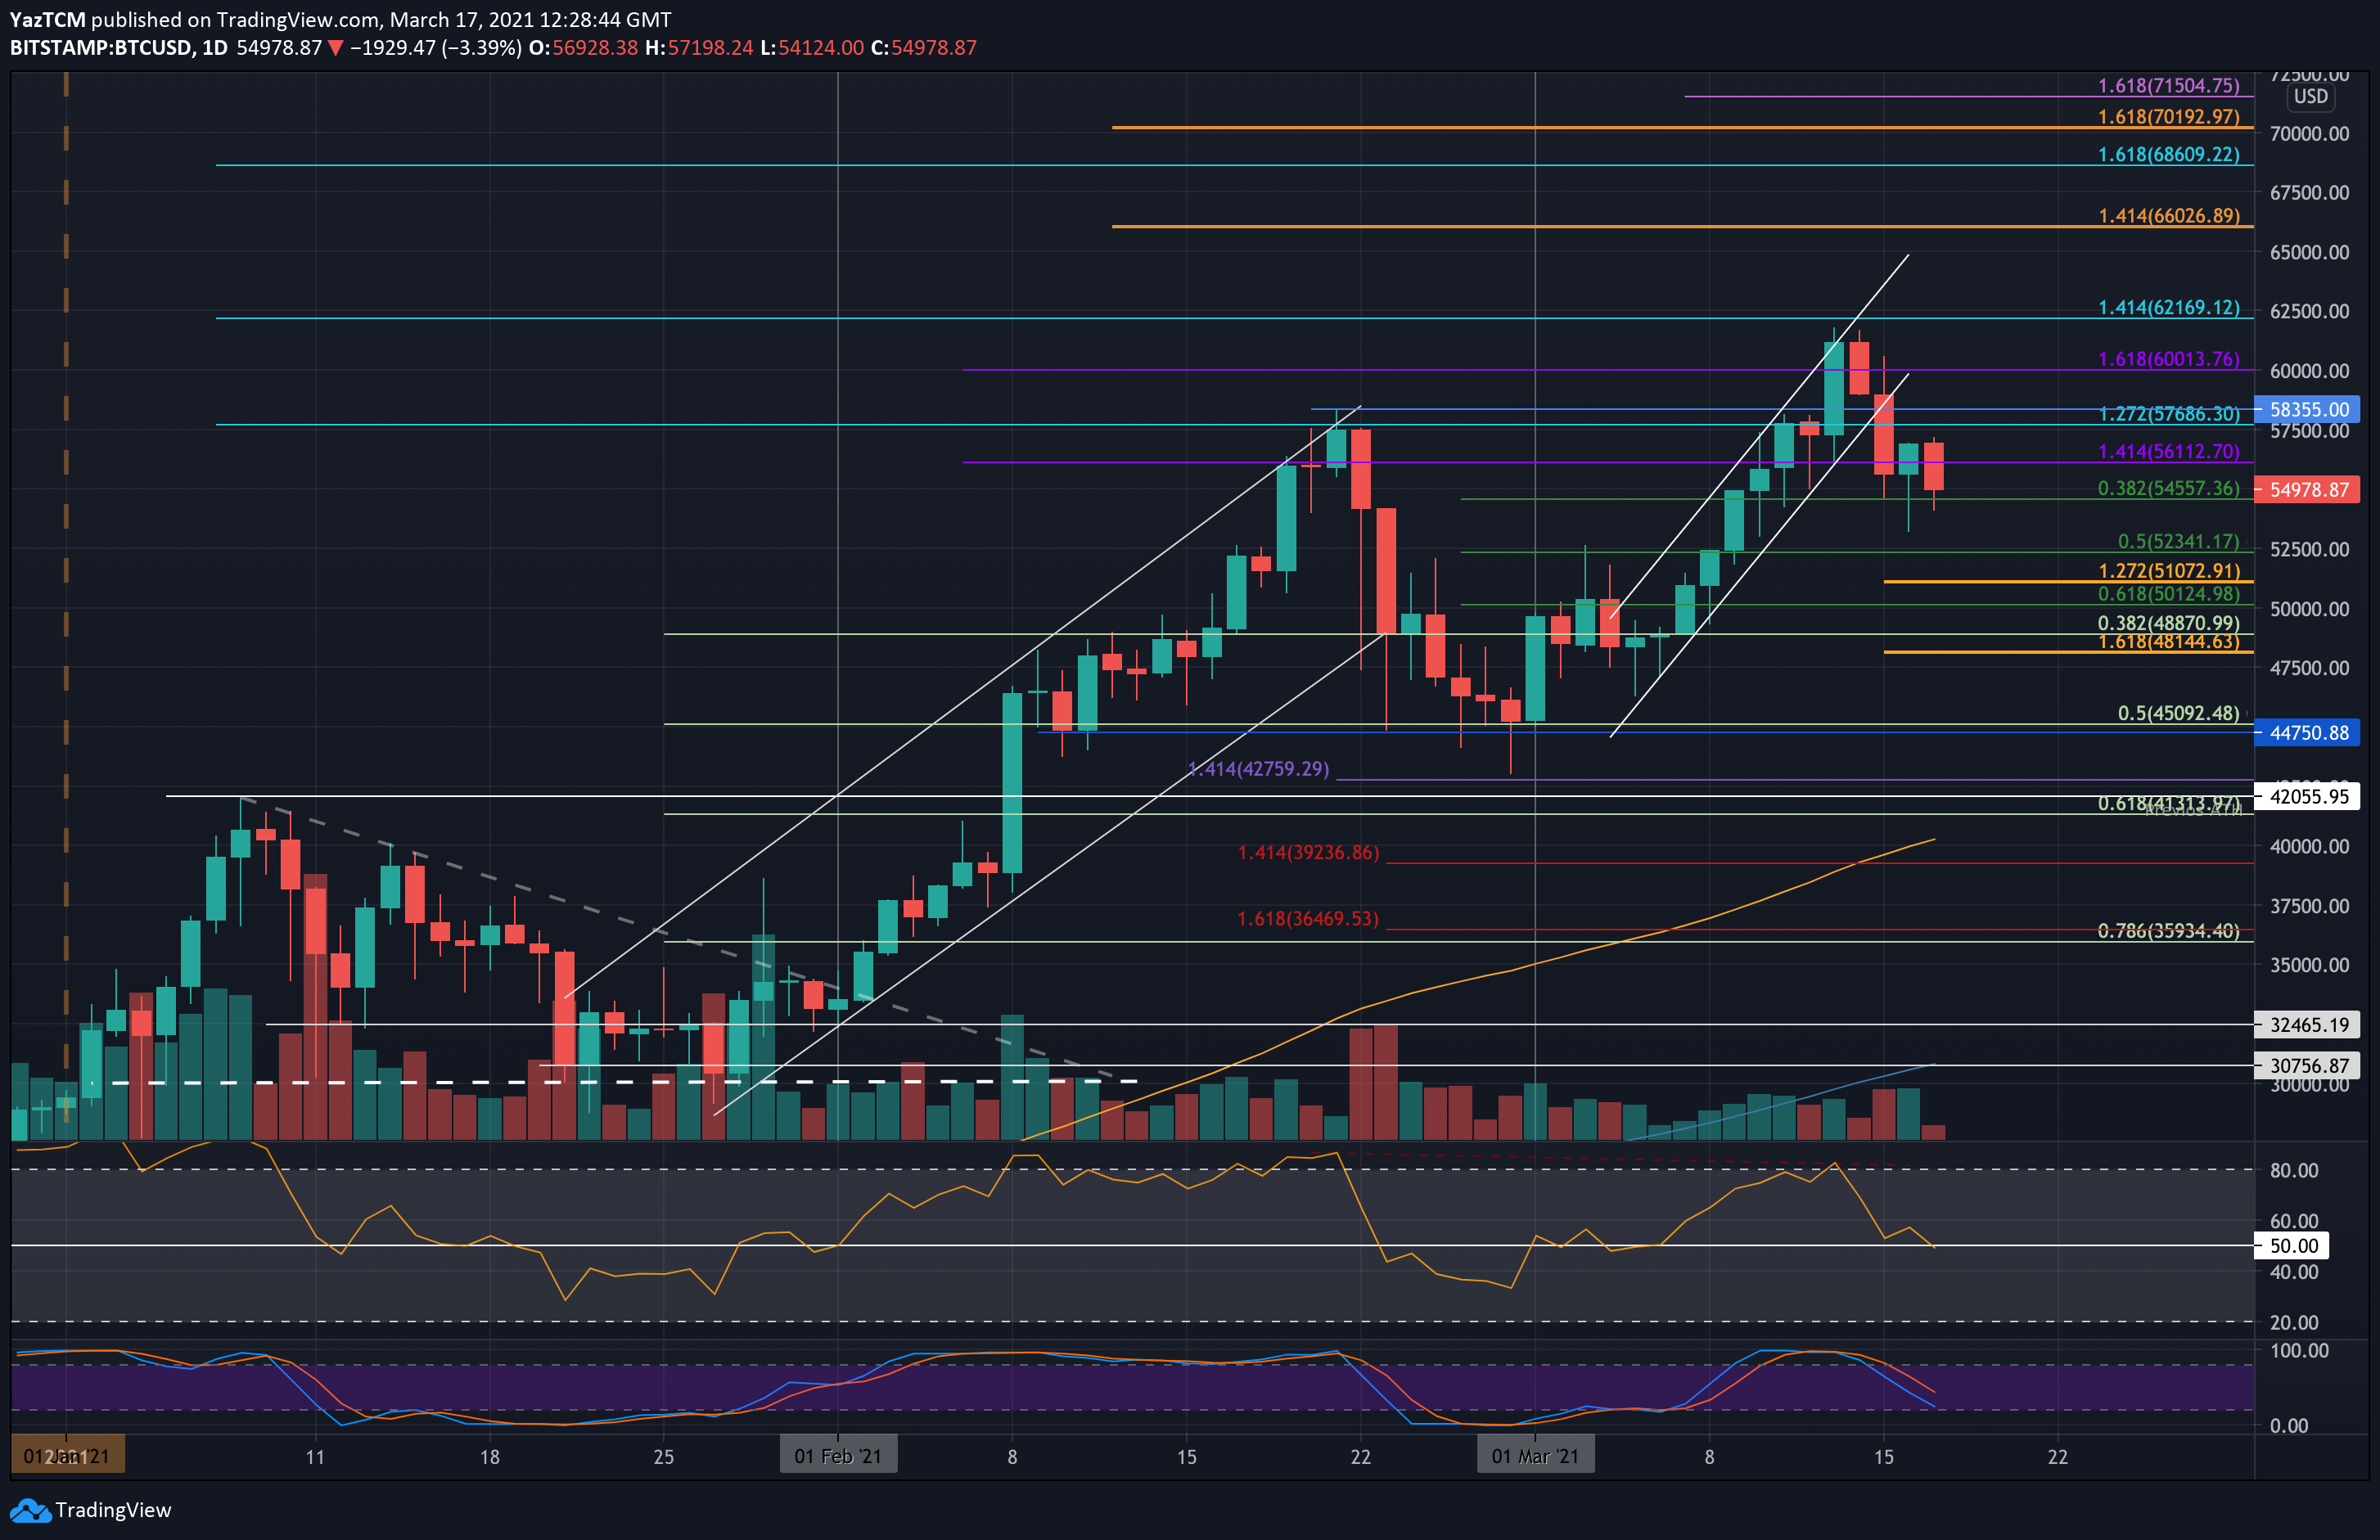
On the bigger picture, there is a classic bearish divergence that has formed on the daily time-frame and could be a warning red flag for the bulls. From late-February (the previous ATH of $58K) to last week, price action was making higher highs while the RSI made lower highs.
Bitstamp BTC/USD Daily Chart
Bitstamp BTC/USD 4-Hour Chart