Bitcoin Price Analysis: BTC Consolidation Period Might End-Up In a Sharp Price Move Soon
Following our recent Bitcoin price analysis, and over the past three days, the coin was marking its clear trading area: from above the 2019 high at $9400, whereas from the lower border, lies the strong support area of $8800.
Any move outside the above territory will probably decide Bitcoin’s direction for the next couple of days.
By looking on yesterday’s trading day, we can’t see any unusual excitement following the official announcement of Libra Global coin by Facebook.
However, there are clear signs about a coming up sharp move, that should be taking place soon. The first is the fact that Bitcoin had gone through significant volatility over the past 2-3 months, so three consecutive calm days is a very rare sight.
Total Market Cap: $287 Billion
Bitcoin Market Cap: $162.8 Billion
BTC Dominance: 56.7%
Looking at the 1-day & 4-hour charts
– Support/Resistance:
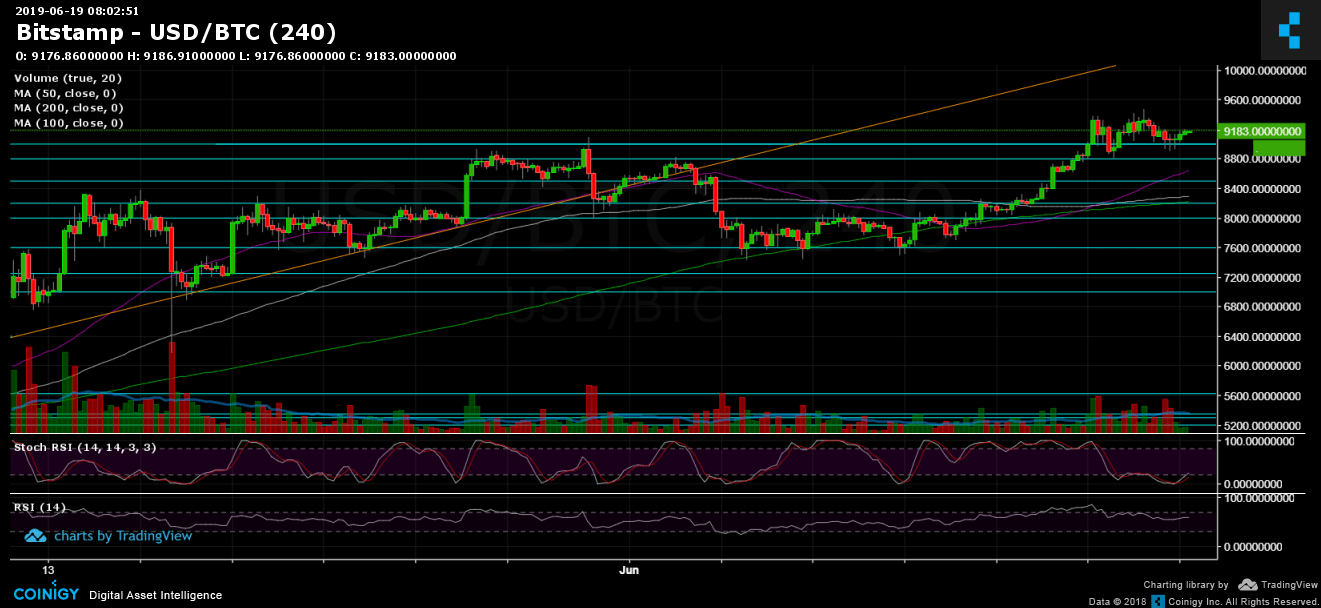
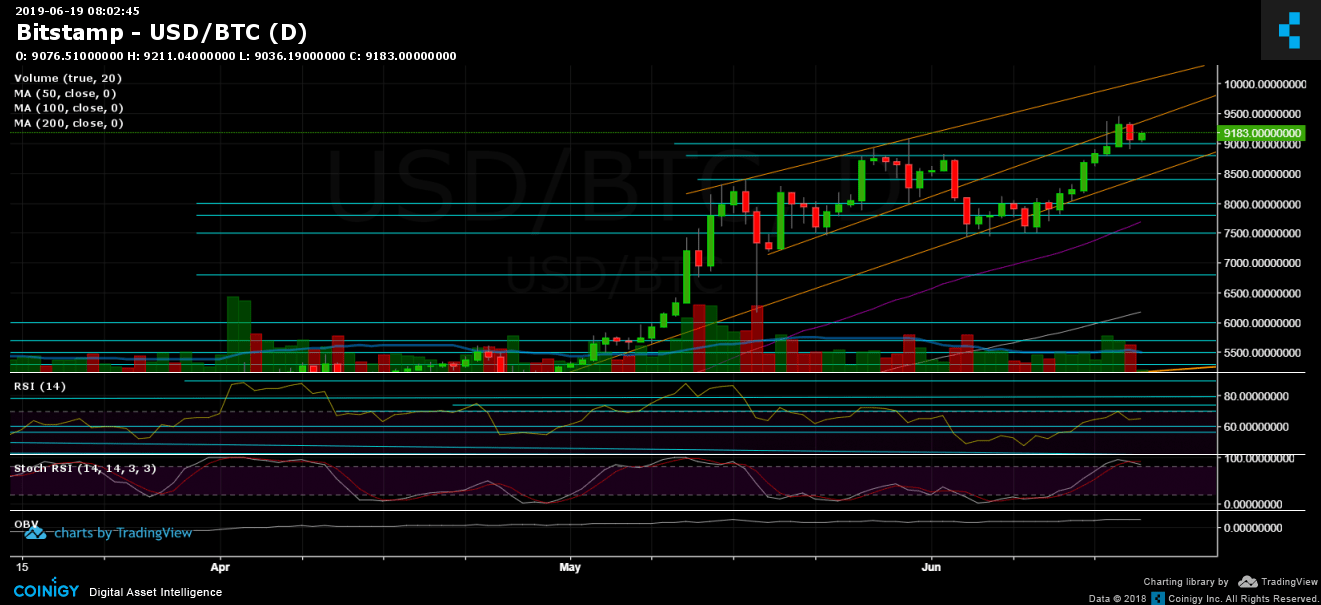
As of writing this, Bitcoin is hovering around the demand zone at $9000 – $9100. In case the last breaks down, we should expect to see the next support level at $8800, along with the daily chart’s lower ascending trend-line (marked in orange). Further below lies $8600 (along with the 4-hour chart’s MA-50, marked in purple), before reaching $8400, $8200 – $8250 and $8100.
From the bullish side, the nearest resistance zone is at $9400, where lies 2019 high. As could be seen on the daily chart, this is precisely where our marked middle ascending trend-line was.
Breaking up the $9400 would probably lead a quick move to the next resistance level at $9600 – $9700, whereas the next resistance for Bitcoin’s price will be a five digits number.
– Trading Volume: Over the past three days, the trading volume is decreasing over time. This face could also be related to the anticipated move, as mentioned above.
– Daily chart’s RSI: After reaching its weekly high at 70 RSI level, the RSI had retraced down to 64. But, it still looks bullish. Looking on the BTC daily chart, the Stochastic RSI oscillator had recently gone through a crossover in the overbought territory and is about to enter the bearish zone (under 80 RSI level). This usually leads to a bearish correction.
– BitFinex open short positions: The open short positions are around their monthly high. This might also be a sign of a coming up move. There are now 25 K BTC open short positions.
BTC/USD BitStamp 4-Hour Chart
BTC/USD BitStamp 1-Day Chart
The post Bitcoin Price Analysis: BTC Consolidation Period Might End-Up In a Sharp Price Move Soon appeared first on CryptoPotato.