Bitcoin Price Analysis: BTC Consolidation Around $11,000, Weekend Breakout Ahead?
After testing $12,000 three days ago, Bitcoin’s 4-hour chart now displays a double bottom at $10,800.
Is the formation still bullish? Time will tell. On the one hand, Bitcoin created a higher low of $10,800 on the 4-hour time frame. If that support doesn’t break down, we will still be in the green in the short term.
Besides, by looking at the daily chart, we can see that the mid-term ascending trend line is standing still. As long as it maintains, the bulls can smile.
Adding to the above, Bitcoin is seeing decreasing volume as well as decreasing price action, which is likely to end soon with a price move. Moreover, it’s now the weekend. Bitcoin loves to demonstrate its volatility during weekends.
Total Market Cap: $322 billion
Bitcoin Market Cap: $202 billion
BTC Dominance Index: 62.6%
*Data by CoinGecko
Now What?
Support/Resistance: From the bullish side, Bitcoin is facing the critical $11,500 – $11,600 resistance level. The next target lies at $11,800 (descending trend line, 4-hour chart), before again reaching the $12,000 level (which is the high from two days ago). Further above lies $12,500 before the 2019 high of $13,500 – $13,880.
From the bearish side, the closest support lies at $11,200. $11K and $10,800 (the low from yesterday) follow. If these levels, along with the ascending mid-term trend line on the daily chart, were broken, the short-term trend would turn bearish. Further below lies $10,600, $10,300 and $9,800. There is also the $9,400 prior high from June, along with the daily chart’s 50-day moving average line.
Daily chart’s RSI: The RSI has remained in the bullish area above 50. However, if Bitcoin overcomes $12,000, we must be aware of negative divergence and, hence, an RSI of above 62-63. The Stochastic RSI oscillator is still awaiting a bullish crossover, which could ignite the next Bitcoin rally.
Trading Volume: See above.
Bitfinex open short positions: Following the odd drop in the number of shorts, the amount of open positions is now 10.9K BTC, which is the highest level in the past five days.
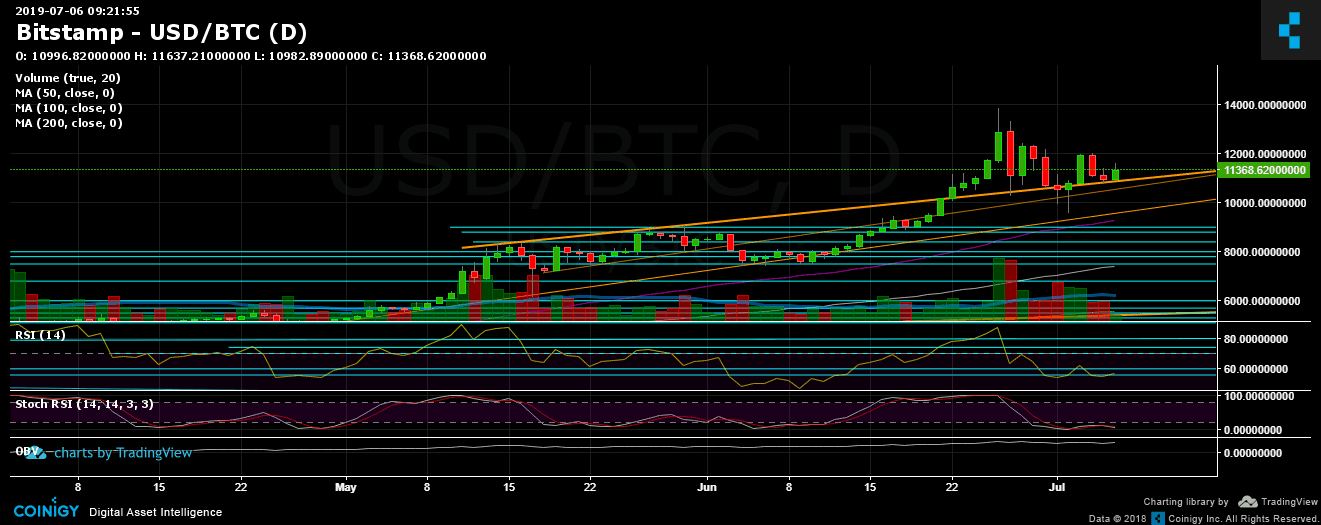
BTC/USD Bitstamp 4-Hour Chart

BTC/USD Bitstamp 1-Day Chart
The post Bitcoin Price Analysis: BTC Consolidation Around $11,000, Weekend Breakout Ahead? appeared first on CryptoPotato.