Bitcoin Price Analysis: BTC Consolidation Around $11,000 Can End In a Weekend Breakout?
Since the impressive spike from three days ago, whereas Bitcoin tested $12,000 again, Bitcoin had seen a double bottom (4-hour chart) at $10,800.
Is the formation still bullish? Time will tell. From the optimistic side, Bitcoin had created a higher low on the 4-hour timeframe ($10,800). For the short term, if the last doesn’t break down, we are still in the green.
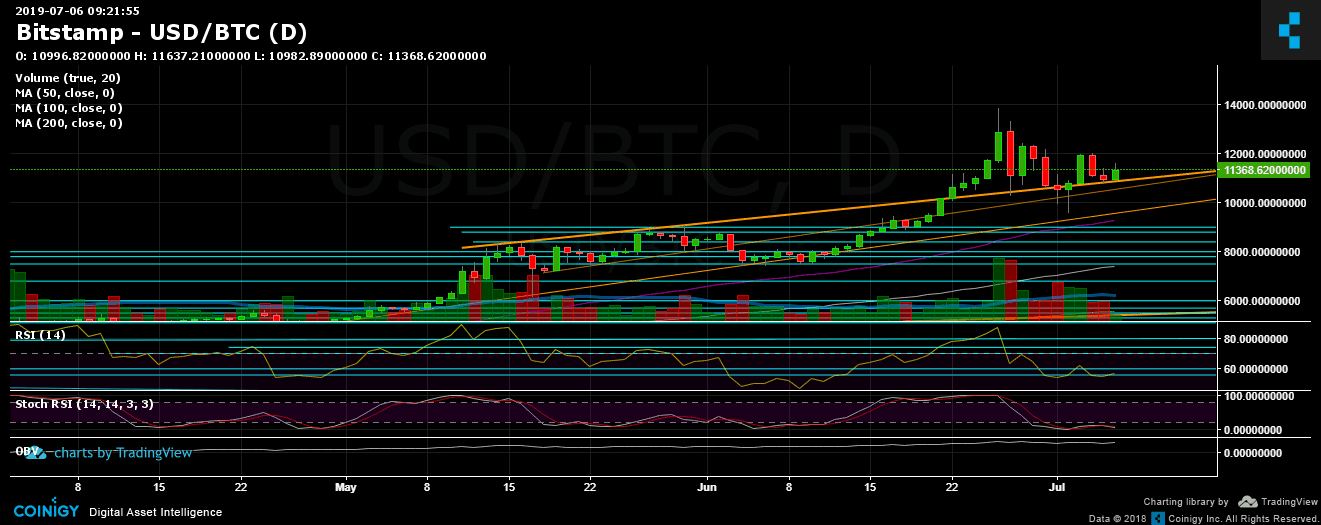
Besides, looking on the daily chart, we can see that the mid-term ascending trend-line is standing still. As long as it maintains, the bulls can smile.
Adding to the above, Bitcoin is seeing a decreasing amount of volume, and decreasing price action, which is likely to end soon with a price move. This also aligns with the fact that it’s now weekend. Bitcoin loves to prove its volatility during weekends.
Total Market Cap: $322 billion
Bitcoin Market Cap: $202 billion
BTC Dominance Index: 62.6%
*Data by CoinGecko
Now What?
– Support/Resistance:
From the bullish side, Bitcoin is facing the critical $11,500 – $11,600 resistance level. Breaking the last and the next target lies at $11,800 (descending trend-line, 4-hour chart), before reaching again the $12,000 level (which is the high from two days ago). Further above, lies $12,500 before the 2019 high at $13,500 – $13,880.
From the bearish side, the closest support lies at $11,200. Before the $11K, and the $10,800 (the low from yesterday). Breaking down the last, along with the ascending mid-term trend line on the daily chart, and the short-term will turn bearish. Further below lies $10,600, $10,300 and $9,800. And to mention the $9,400 prior high (from June), along with the daily chart’s 50-days moving average line.
– Daily chart’s RSI: Looking on the RSI, it maintains the bullish area above 50. However, in case that Bitcoin will overcome $12,000, we must look that there will be no negative divergence, hence, an RSI of above 62-63. The Stochastic RSI oscillator is still waiting for a bullish cross-over and entering the bullish territory. This can ignite the next Bitcoin rally.
– Trading Volume: discussed above.
– BitFinex open short positions: Following the odd drop in shorts, the number of open positions is now at 10.9K BTC positions, which is the highest level during the past five days.
BTC/USD BitStamp 4-Hour Chart

BTC/USD BitStamp 1-Day Chart

The post Bitcoin Price Analysis: BTC Consolidation Around $11,000 Can End In a Weekend Breakout? appeared first on CryptoPotato.


