Bitcoin Price Analysis: BTC Can Drop to $24K If Bearish Sentiment Continues
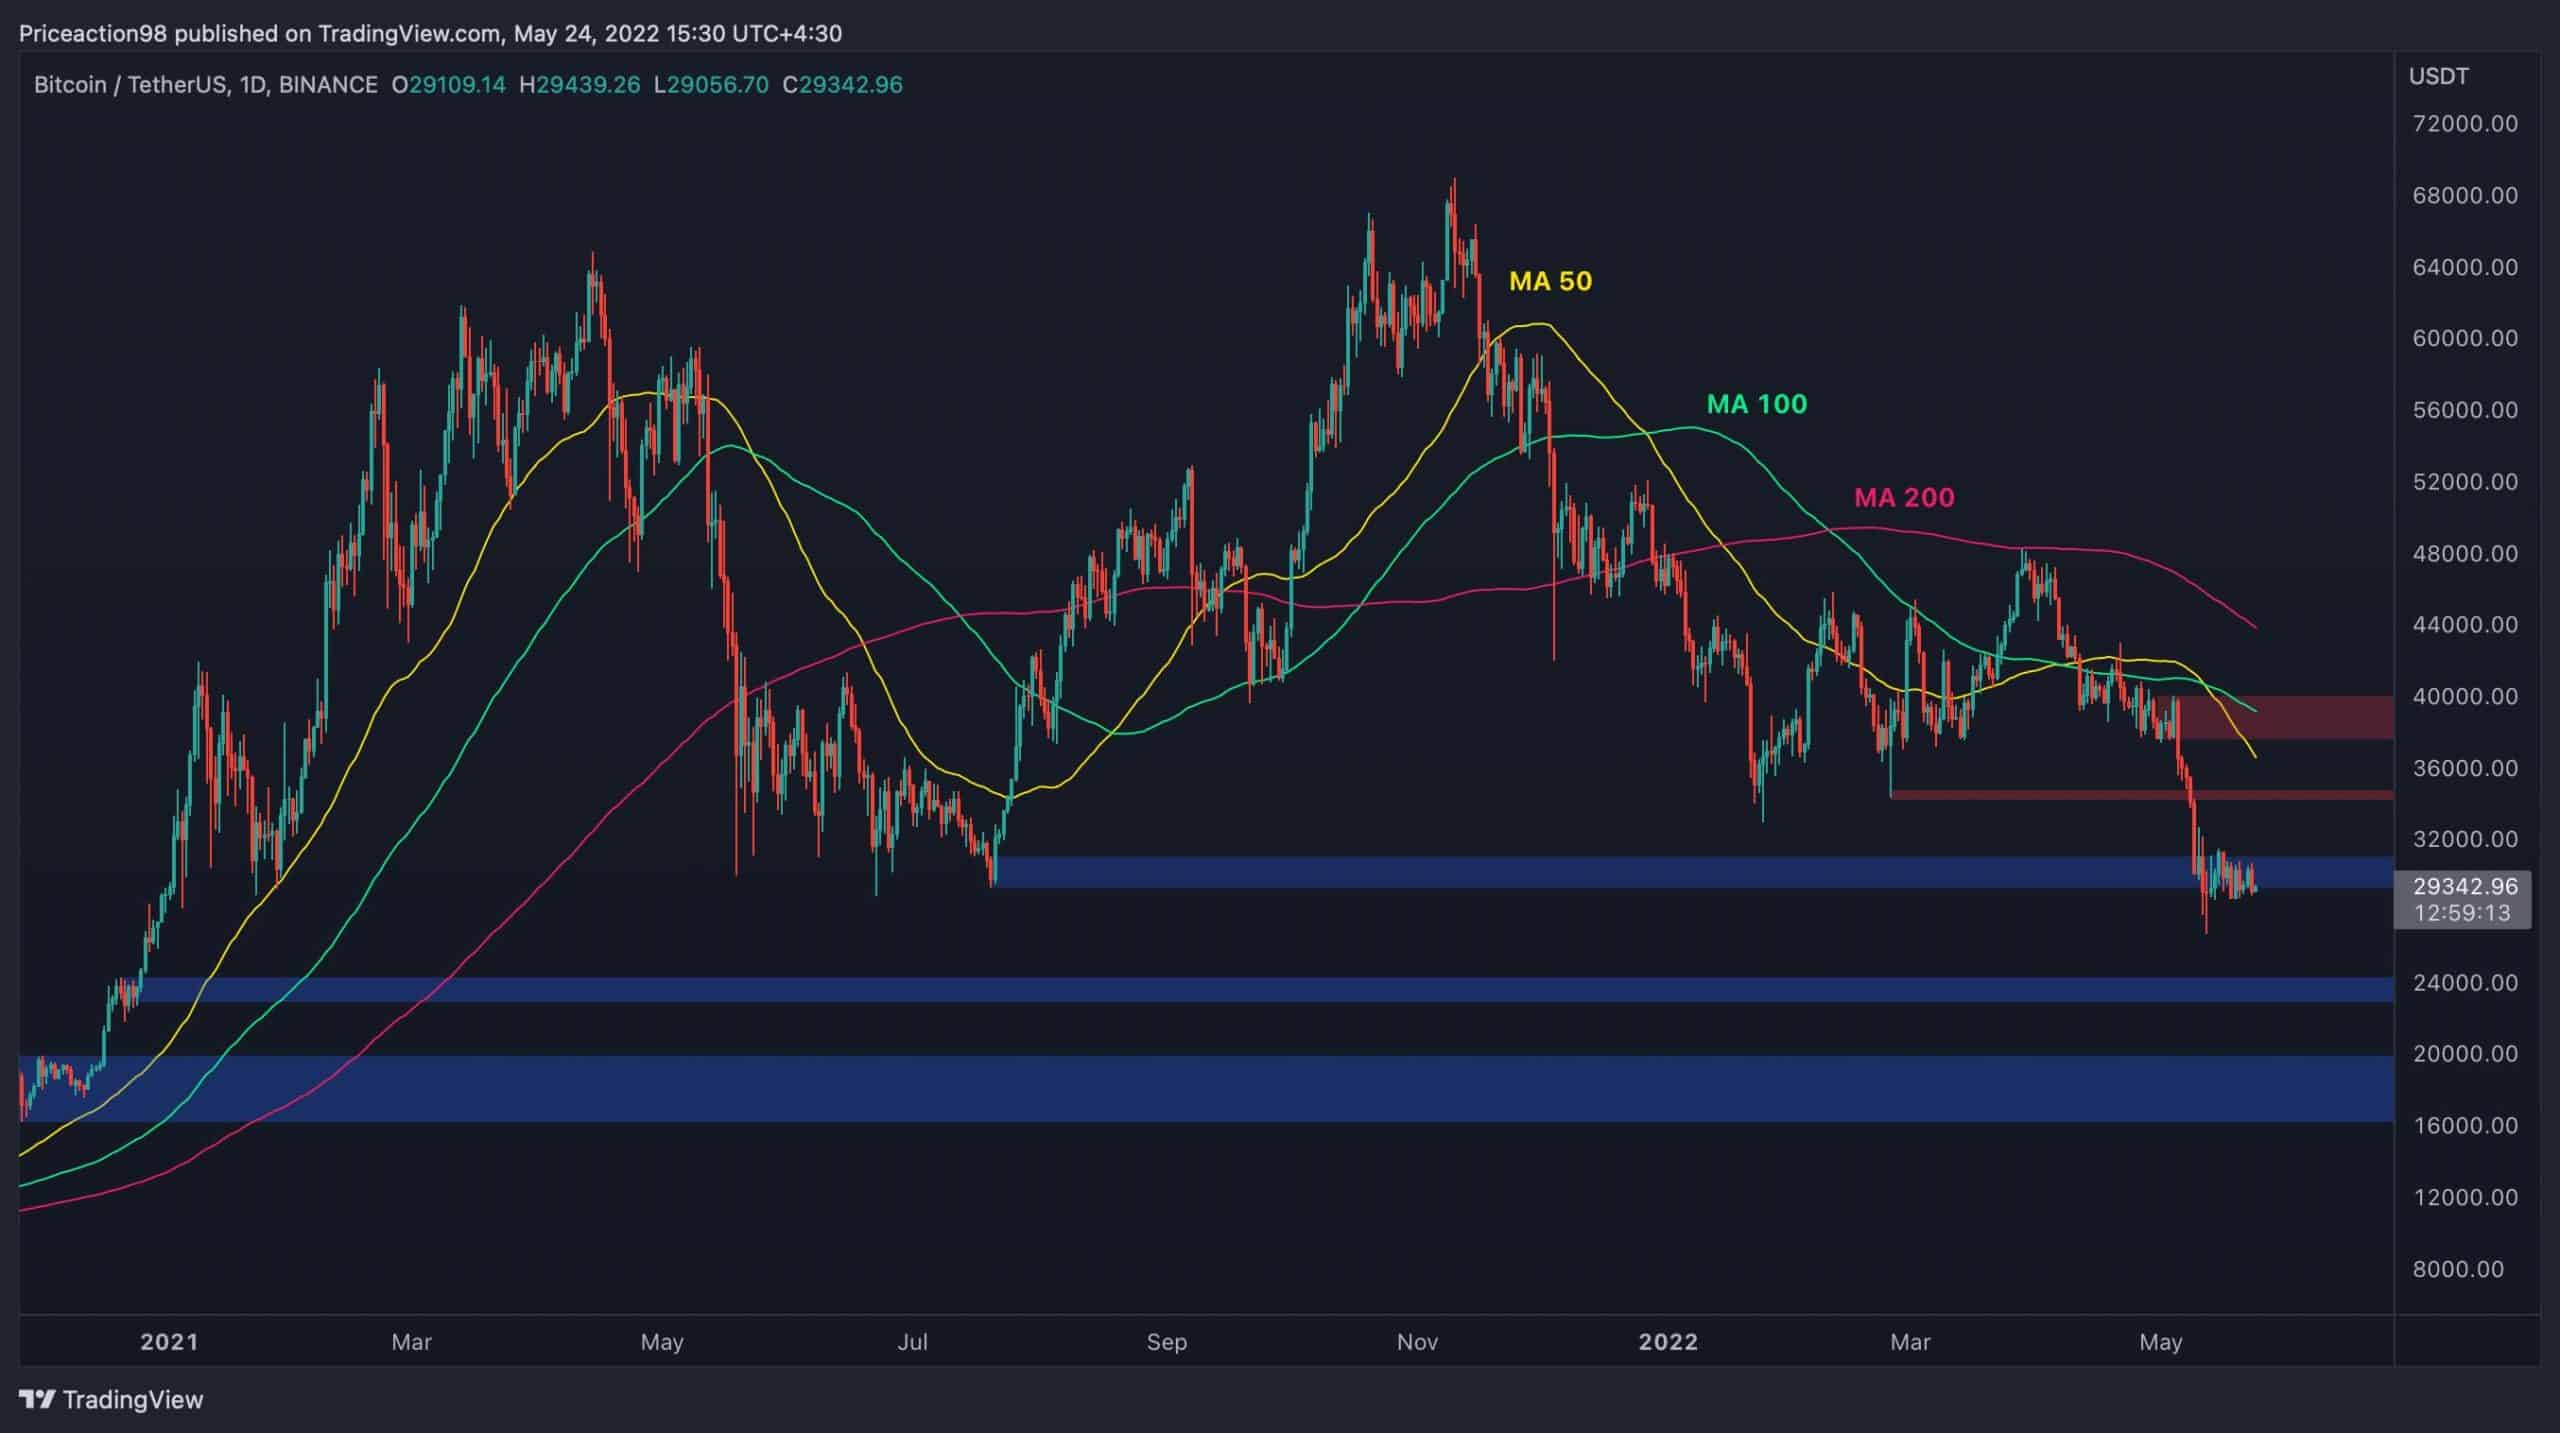
Bitcoin’s rapid downtrend has halted, as the price has been consolidating in the $29K-$30K area over the last few days. The $28K-$30K bottom of the 2021 crash is currently acting as support and has held the price for a couple of weeks.
Technical Analysis
By Edris
The Daily Chart
Currently, if the price breaks the $28K-$30K area to the downside, a deeper drop towards $24K and even towards the $20K level could be expected. On the other hand, if the price can rebound from this area, the $35K resistance level and the $40K supply zone could act as static obstacles, while the 50-day and 100-day moving averages would be dynamic resistance levels.
All in all, a downtrend continuation seems to be the more probable scenario. However, a short-term pullback can be expected before any further downside, as Bitcoin is massively oversold.

The 4-Hour Chart
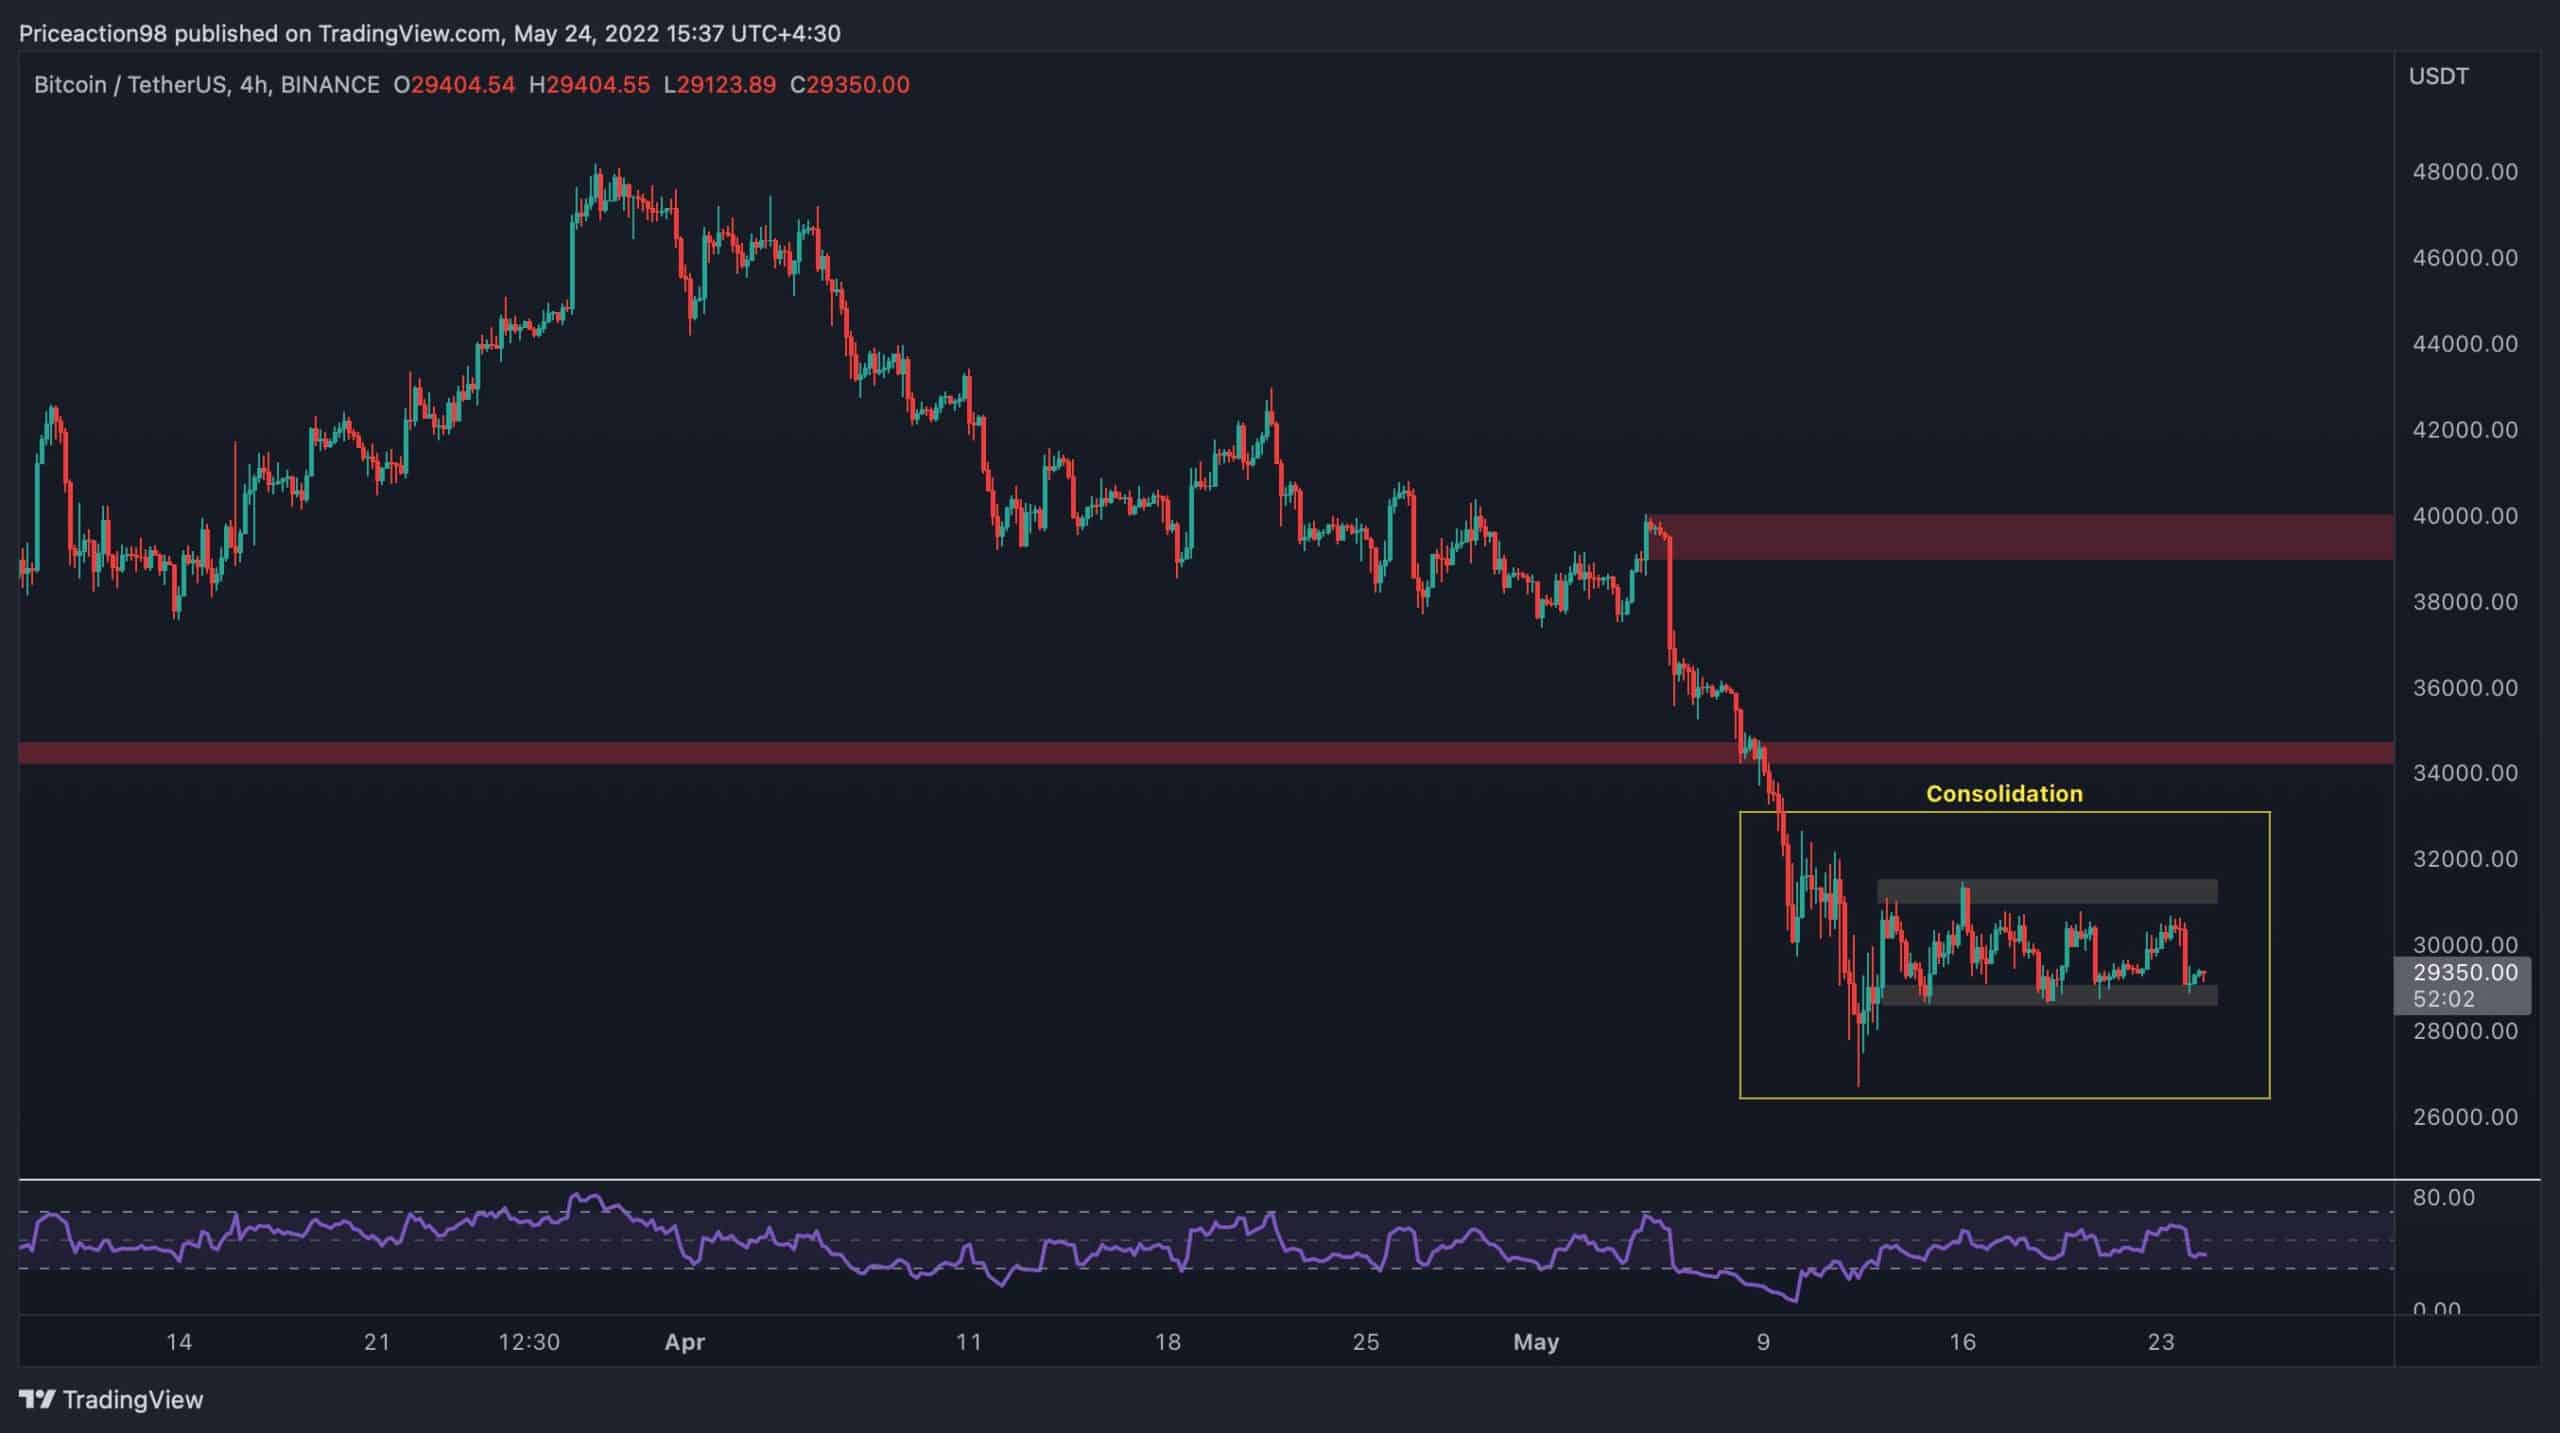
On the 4-hour timeframe, the price has failed to retest the broken $35K level over the past few weeks and is currently oscillating in a tight range below it. This consolidation phase could be laying the framework for the next rapid movement, and a valid breakout from either the high or the low of the tight range could determine the trend in the short term.

The RSI has also broken below the 50% level, indicating that the bears are again in control, and a bearish breakout from the current range could be likely. On the other hand, if the price escapes the current range to the upside, a retest of the $35K level would be the first target.
Onchain Analysis
By Shayan
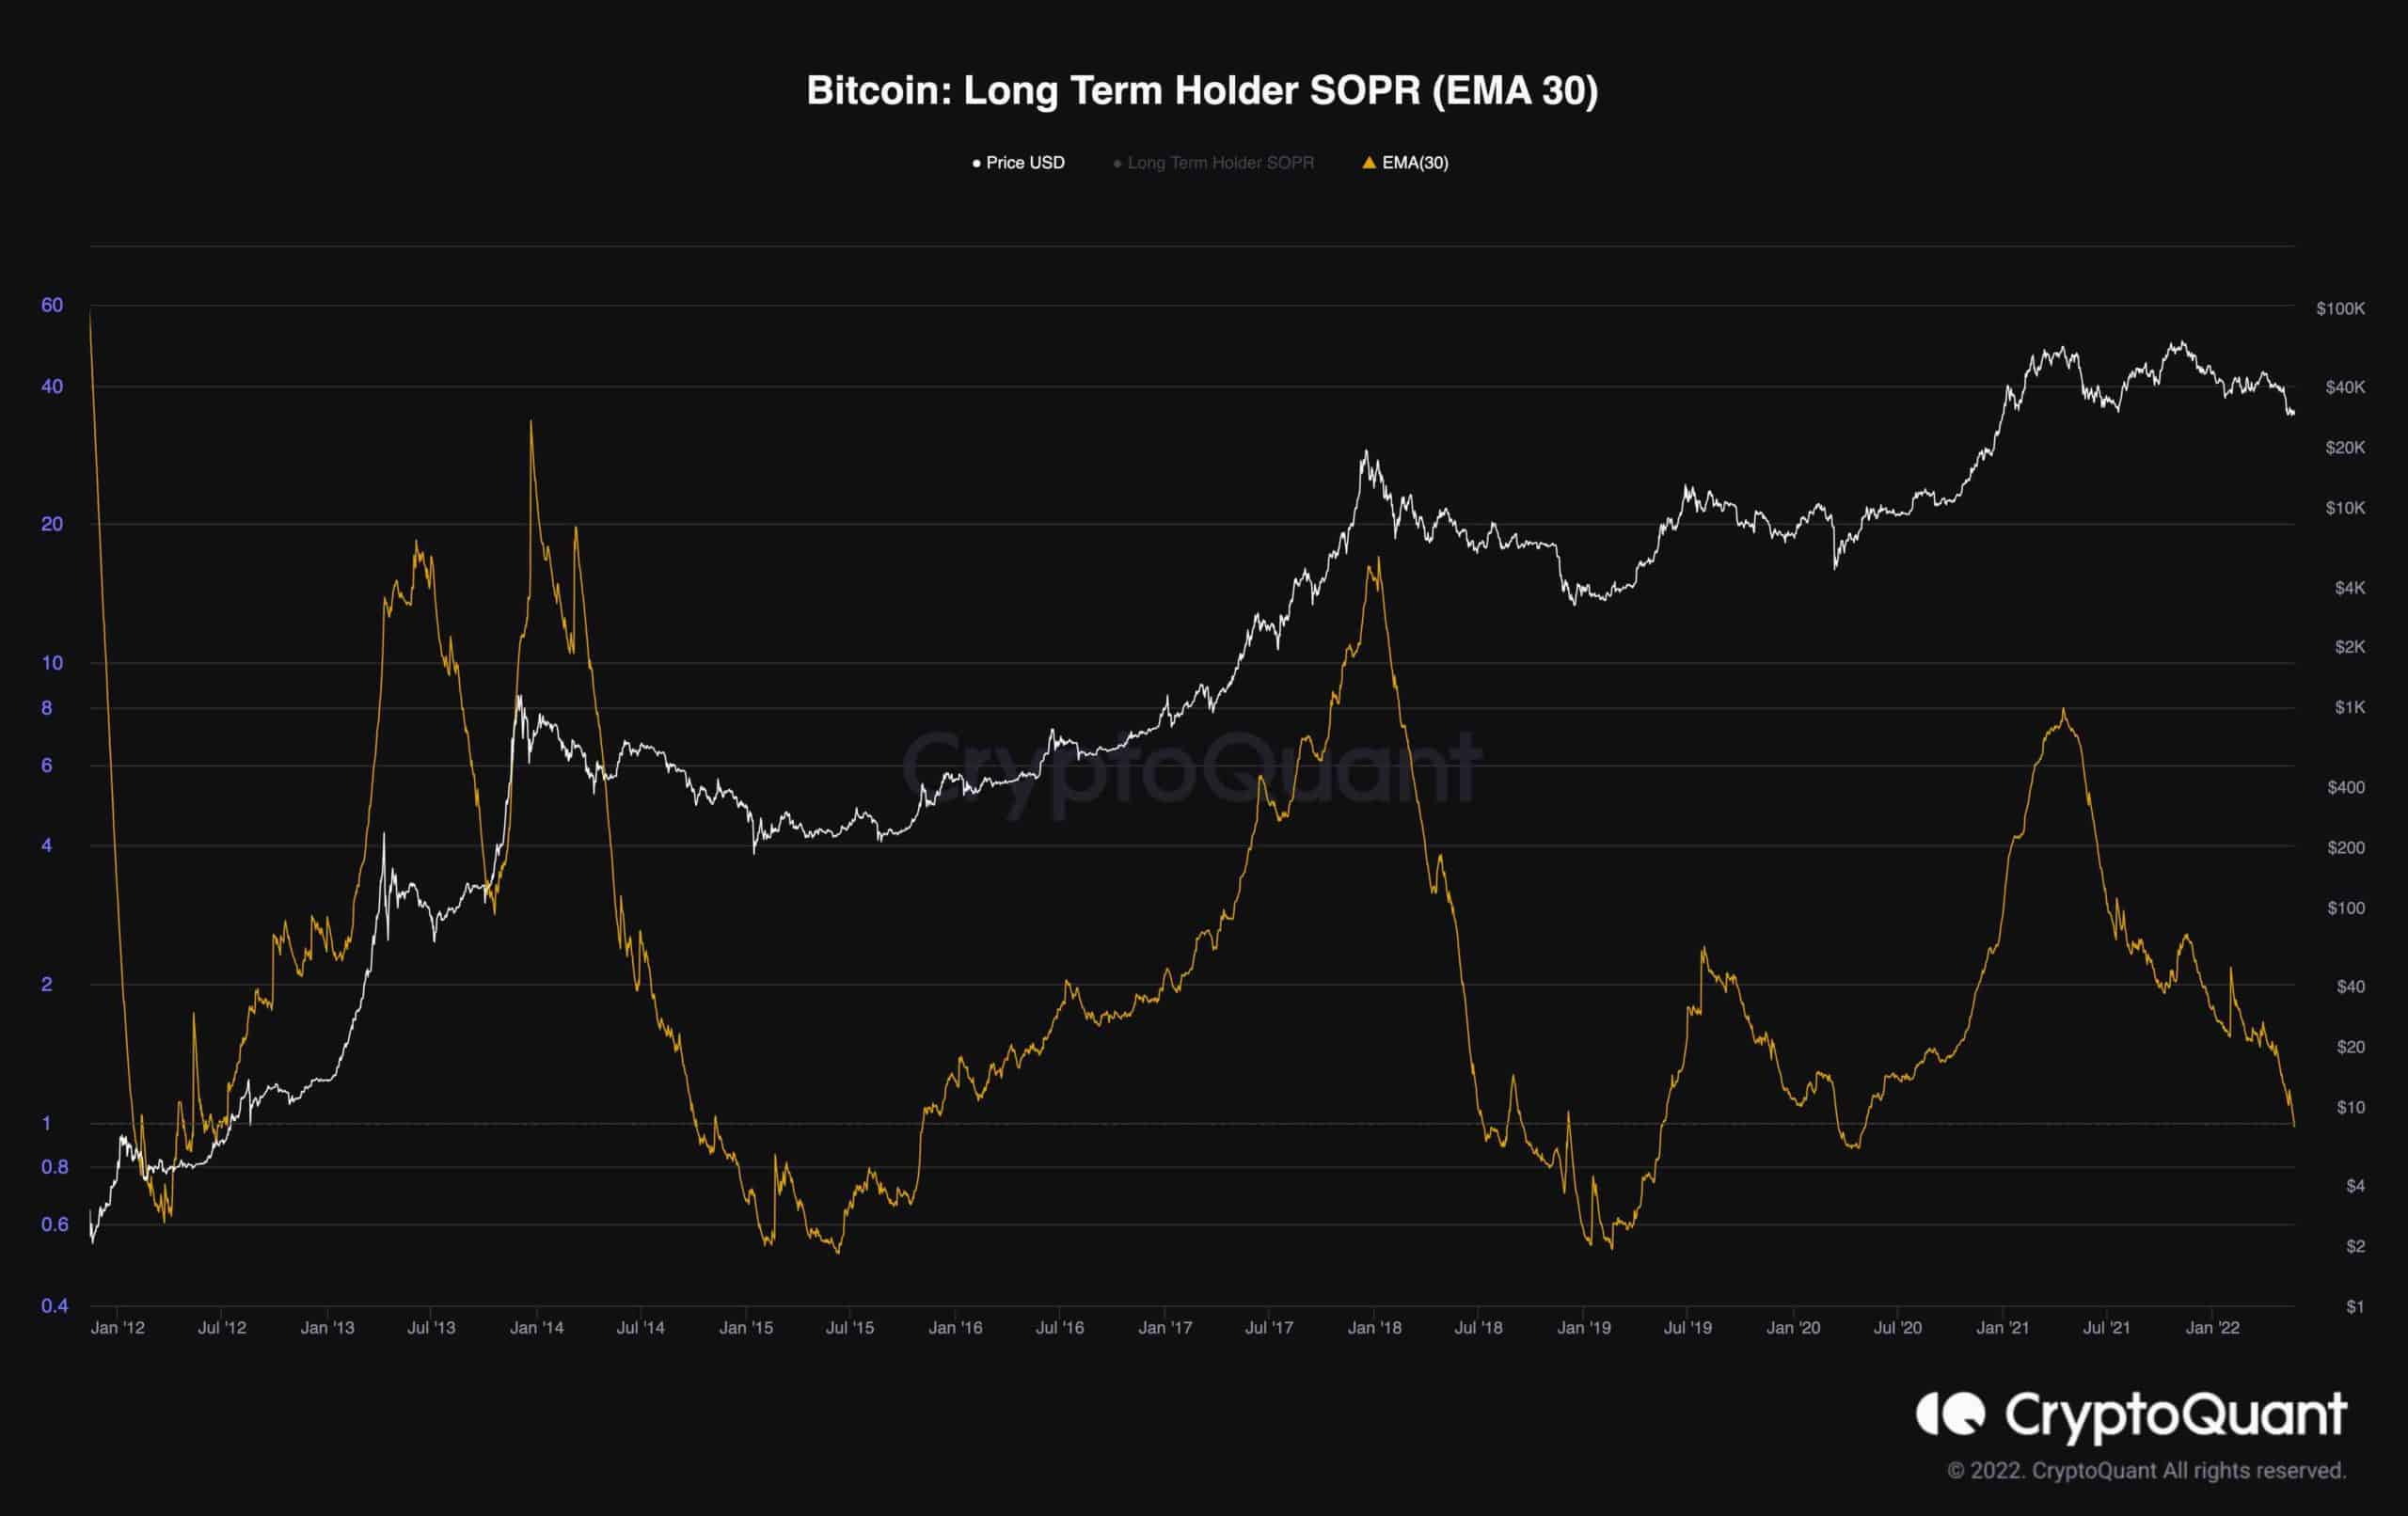
This chart consists of the 30-day exponential moving average of the Long-Term Holder SOPR and Bitcoin’s price. Historically, the LTH-SOPR shows values below one at the end of the bear market, usually when a capitulation event has occurred. Then, the big players also start to move their coins in a total loss which can be interpreted as selling pressure under fear and doubt (capitulation).
The Long-Term Holder SOPR (EMA 30) has dropped below 1, a bearish sign for the market, indicating that long-term holders could be losing faith and selling their assets. This has frequently triggered the final phase of the bear market. However, it should be mentioned that this stage could take a few frustrating months of choppy price action alongside multiple significant shakeouts.


