Bitcoin Price Analysis: BTC Bulls Eye $80K Following 8% Weekly Surge
Bitcoin’s price has finally broken its record high after a gradual uptrend over the last couple of months. Investors are now wondering how far BTC can go.
Bitcoin Price Analysis
By Edris Derakhshi (TradingRage)
The Daily Chart
On the daily timeframe, it is evident that the price has broken the previous all-time high of $74K with considerable force. With the market still trading near its 200-day moving average, BTC can go much higher in the coming months. Therefore, the $80K level could be a viable target in the short term.
Meanwhile, the RSI is showing an overbought signal again, which could point to a potential consolidation or short-term correction soon.
Yet, as long as the market remains above the 200-day moving average, which is located around the $64K level, the overall trend remains bullish, and higher prices could be expected.

The 4-Hour Chart
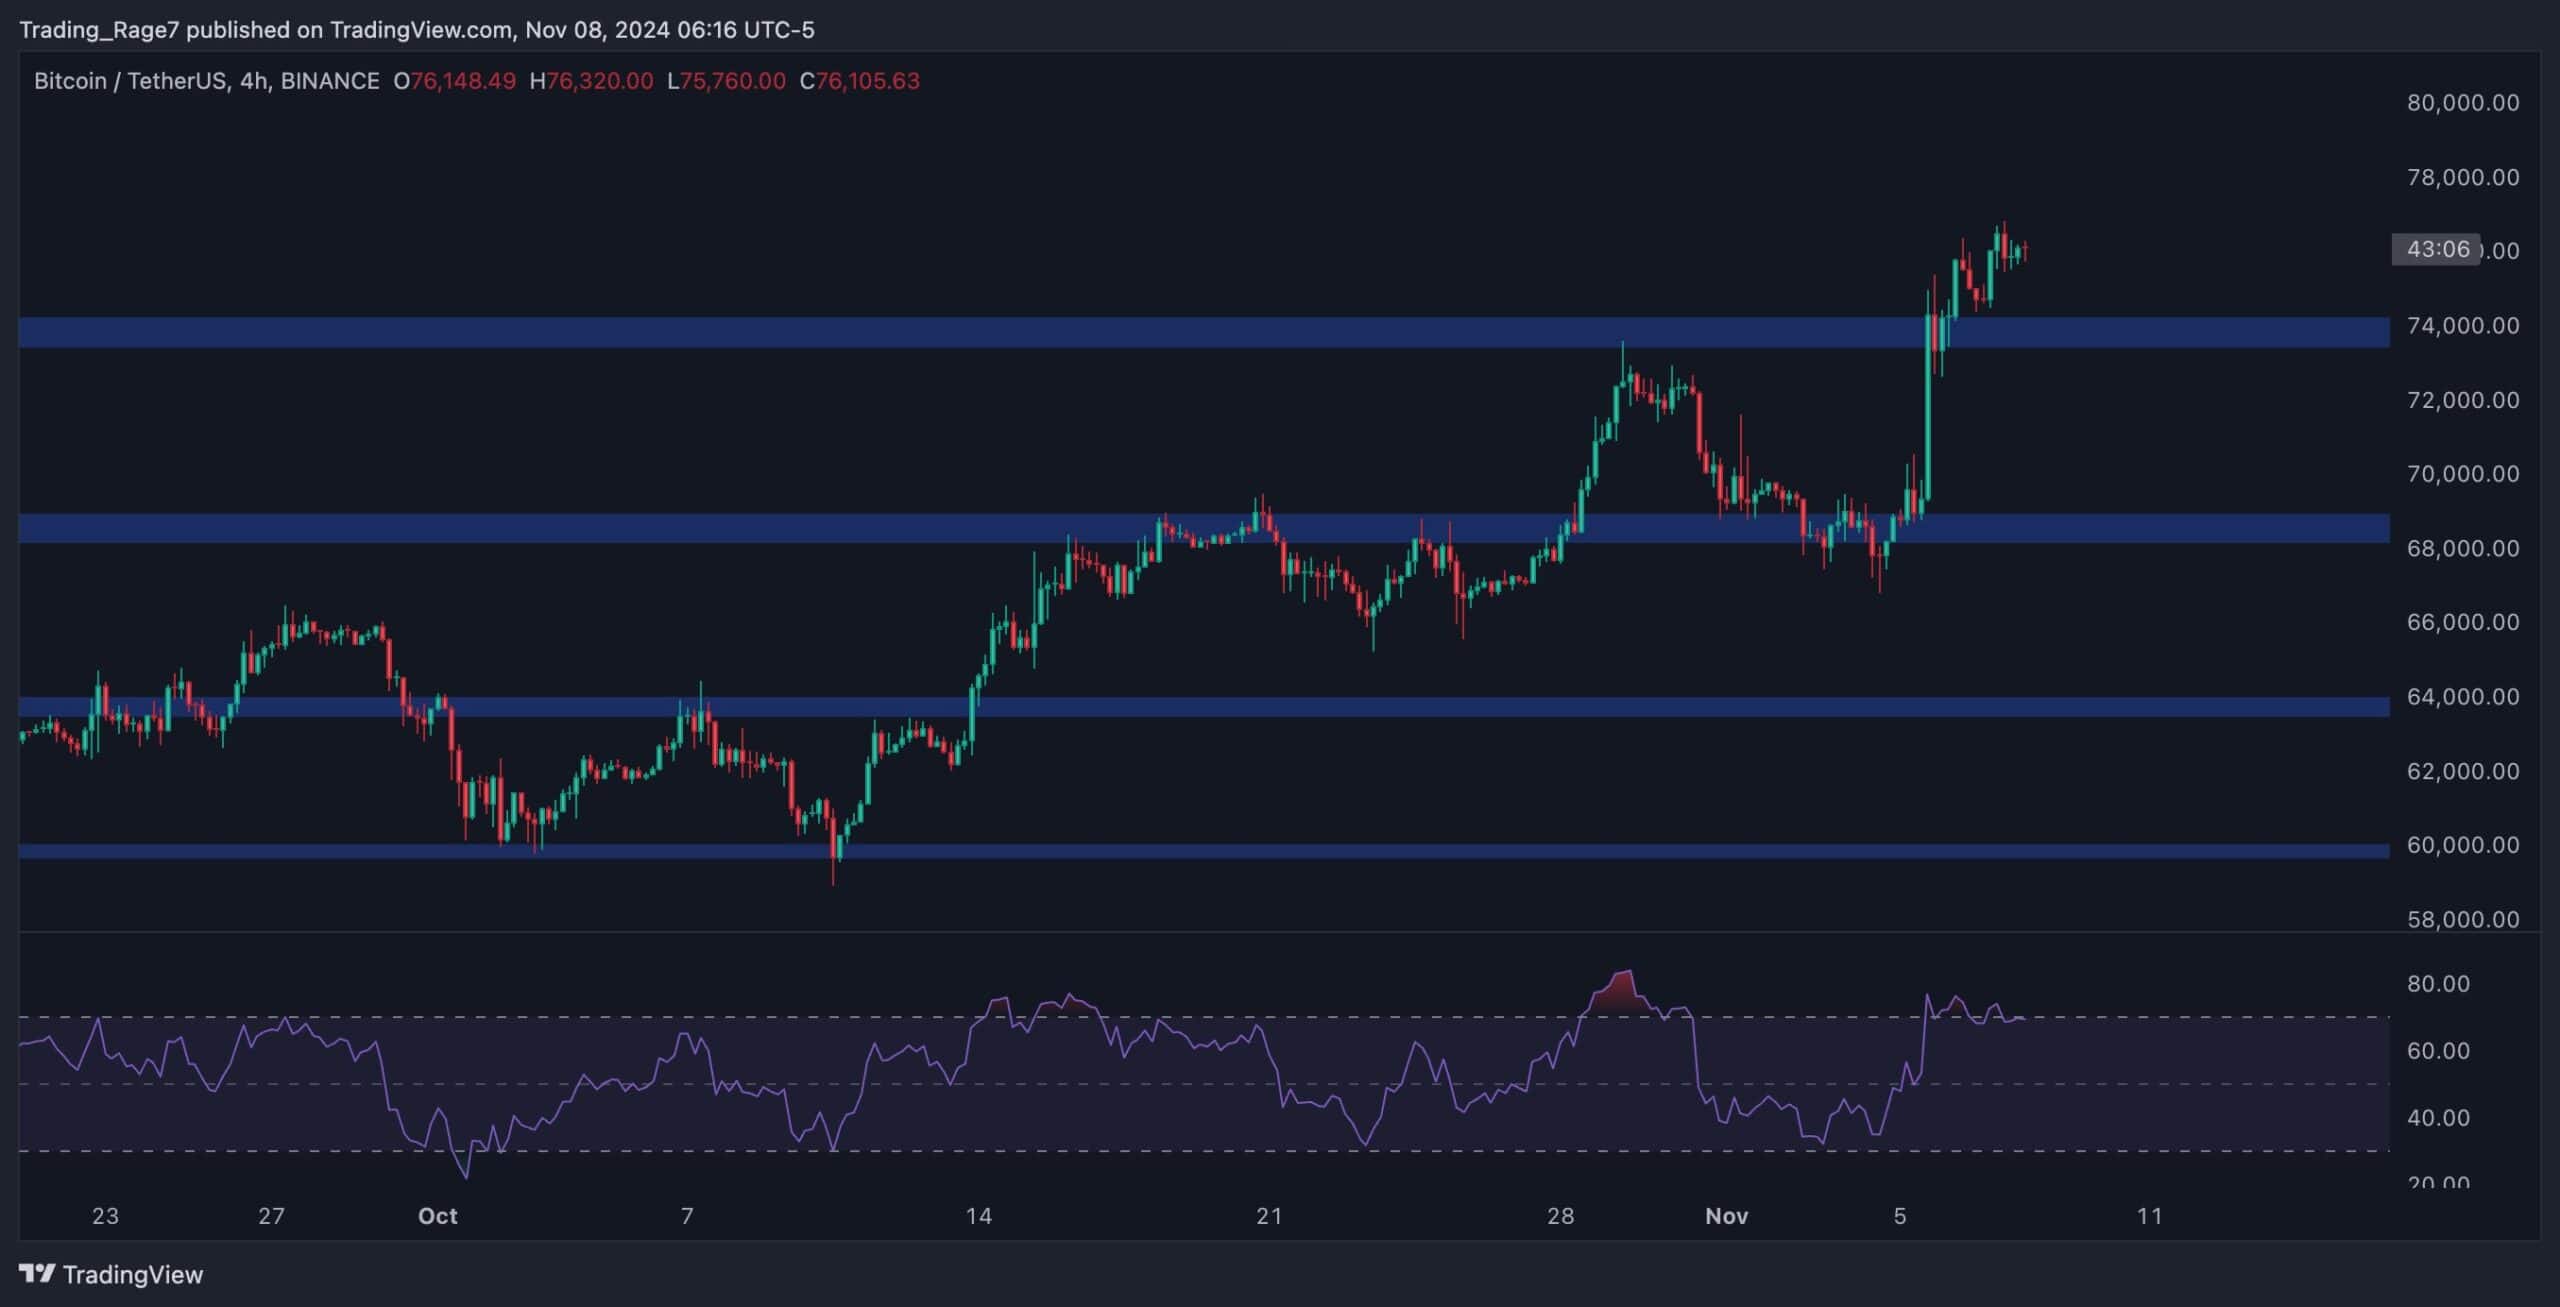
Looking at the 4-hour chart, things look almost similar. A few days ago, the price rapidly rebounded from the $68K level. This significant surge led to a bullish breakout from $74K, as BTC created a new all-time high.
Meanwhile, the RSI also shows an overbought signal in this timeframe. Therefore, a pullback to $74K might occur soon before the market continues higher and toward the $80K mark.

Sentiment Analysis
By Edris Derakhshi (TradingRage)
Bitcoin Funding Rates
While Bitcoin’s price has finally created a new all-time high, market participants are hopeful that a new rally has begun. In this situation, analyzing the futures market sentiment can be very helpful, as it significantly influences short-term price fluctuations.
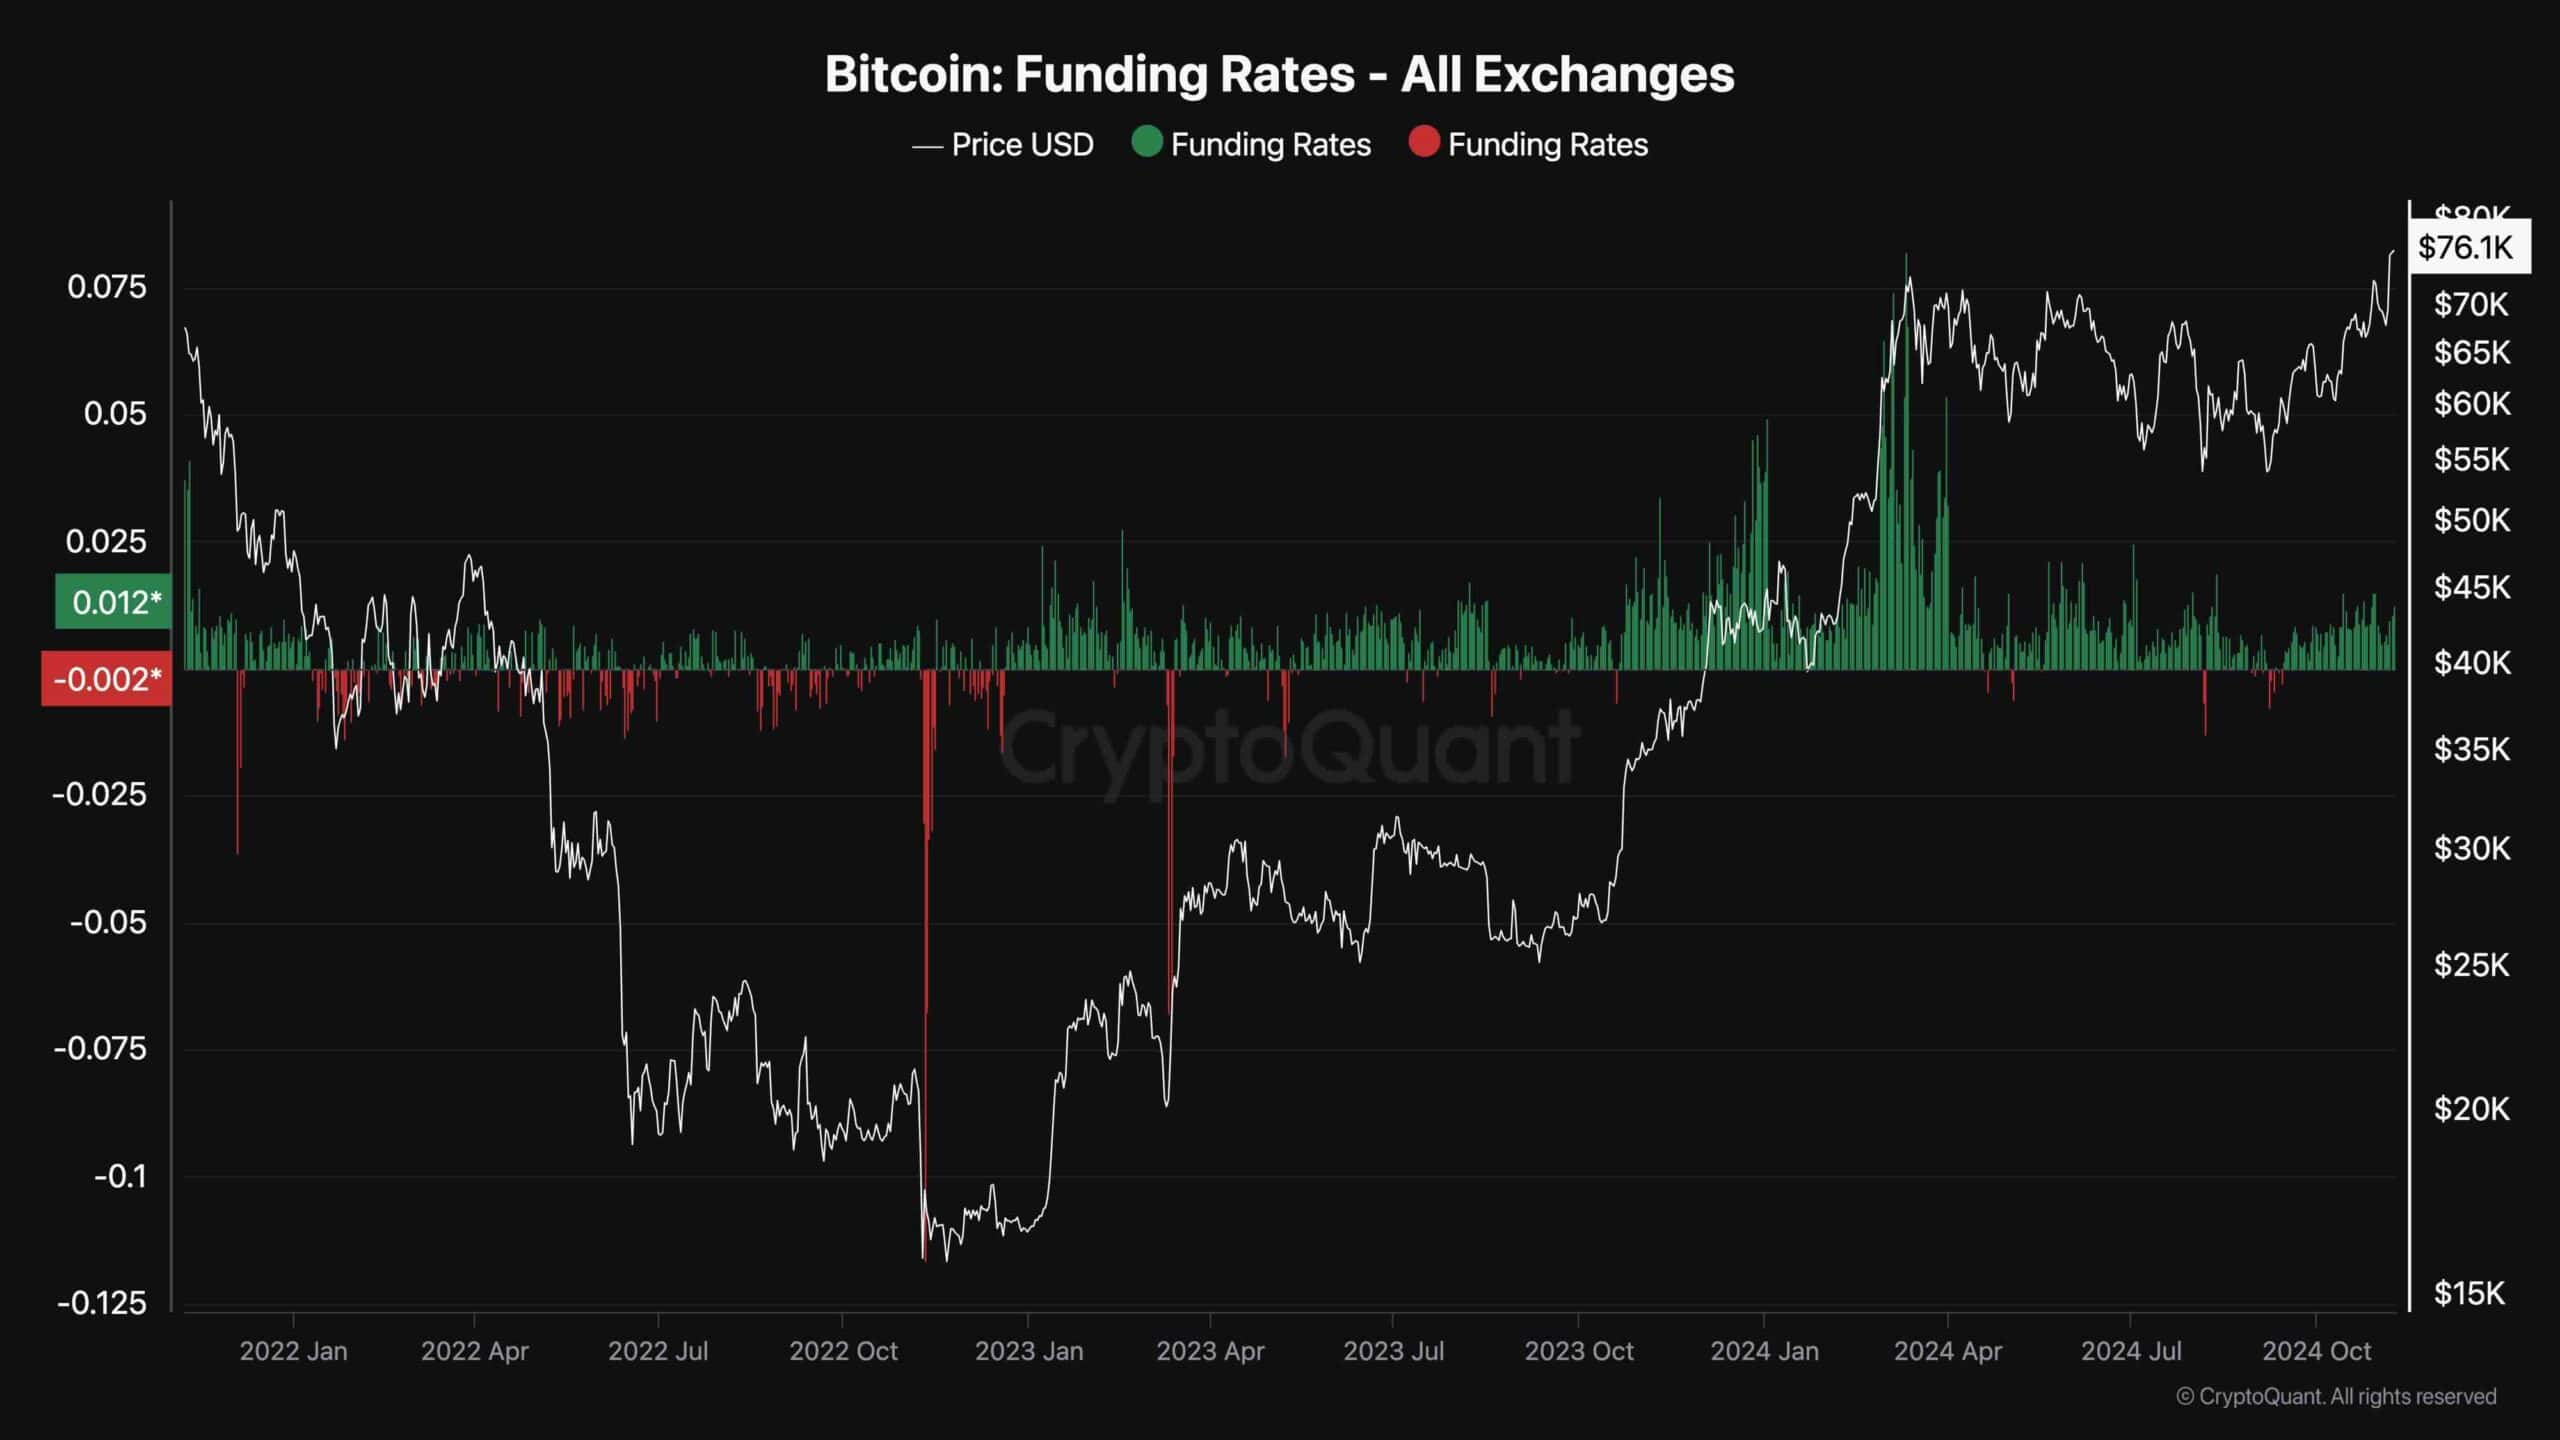
This chart presents the BTC funding rates metric, which measures whether the buyers or the sellers are executing their orders more aggressively. Positive values indicate bullish sentiment and negative ones are associated with bearish market sentiment.
As the chart suggests, the BTC funding rates have been positive over the last few weeks. Yet, while the market has created a new all-time high, the funding rate values are still much lower than those witnessed during the last record high earlier this year. Therefore, it can be assumed that the futures market is still far from overheating, and Bitcoin could still rise higher in the coming months.

The post Bitcoin Price Analysis: BTC Bulls Eye $80K Following 8% Weekly Surge appeared first on CryptoPotato.


