Bitcoin Price Analysis: BTC Approaches Consolidation Apex, Huge Move Imminent
BTC is down a total of 6% over the week, as of now, while it currently battles to remain above $32K. The primary cryptocurrency has been trading inside a long period of consolidation between $30K and $40.5K since the mid-May capitulation candle and between $30K and $35K over the past month.
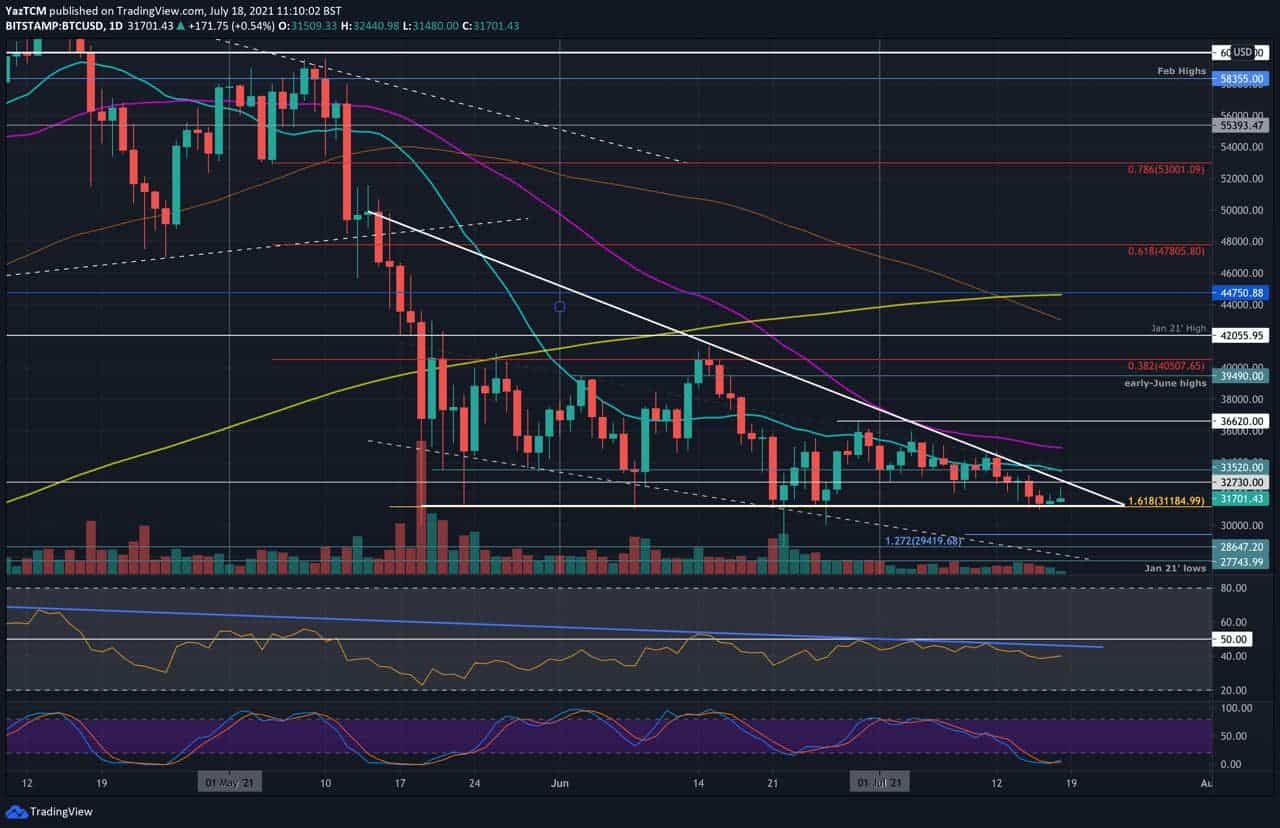
This consolidation can be seen in the form of a bearish triangle, as shown below on the daily chart.
Same as it happened over the past weeks when BTC tested the $30-31K lows, this week’s low lies amid the same support line – $31K from Friday.
This critical range has supported the market on numerous occasions since mid-May. Thus, it will be a crucial support to defend to prevent a slide beneath $30K.
BTC is now quickly approaching the apex of the triangle, as seen on the following daily chart, indicating a potentially colossal move incoming over the next days or even hours.
From the technical point of view – the Bollinger Bands are very squeezed, along with the decreasing amount of volume. From the fundamental point of view – the market anticipates the GBTC unlocking event, which starts today – July 18.
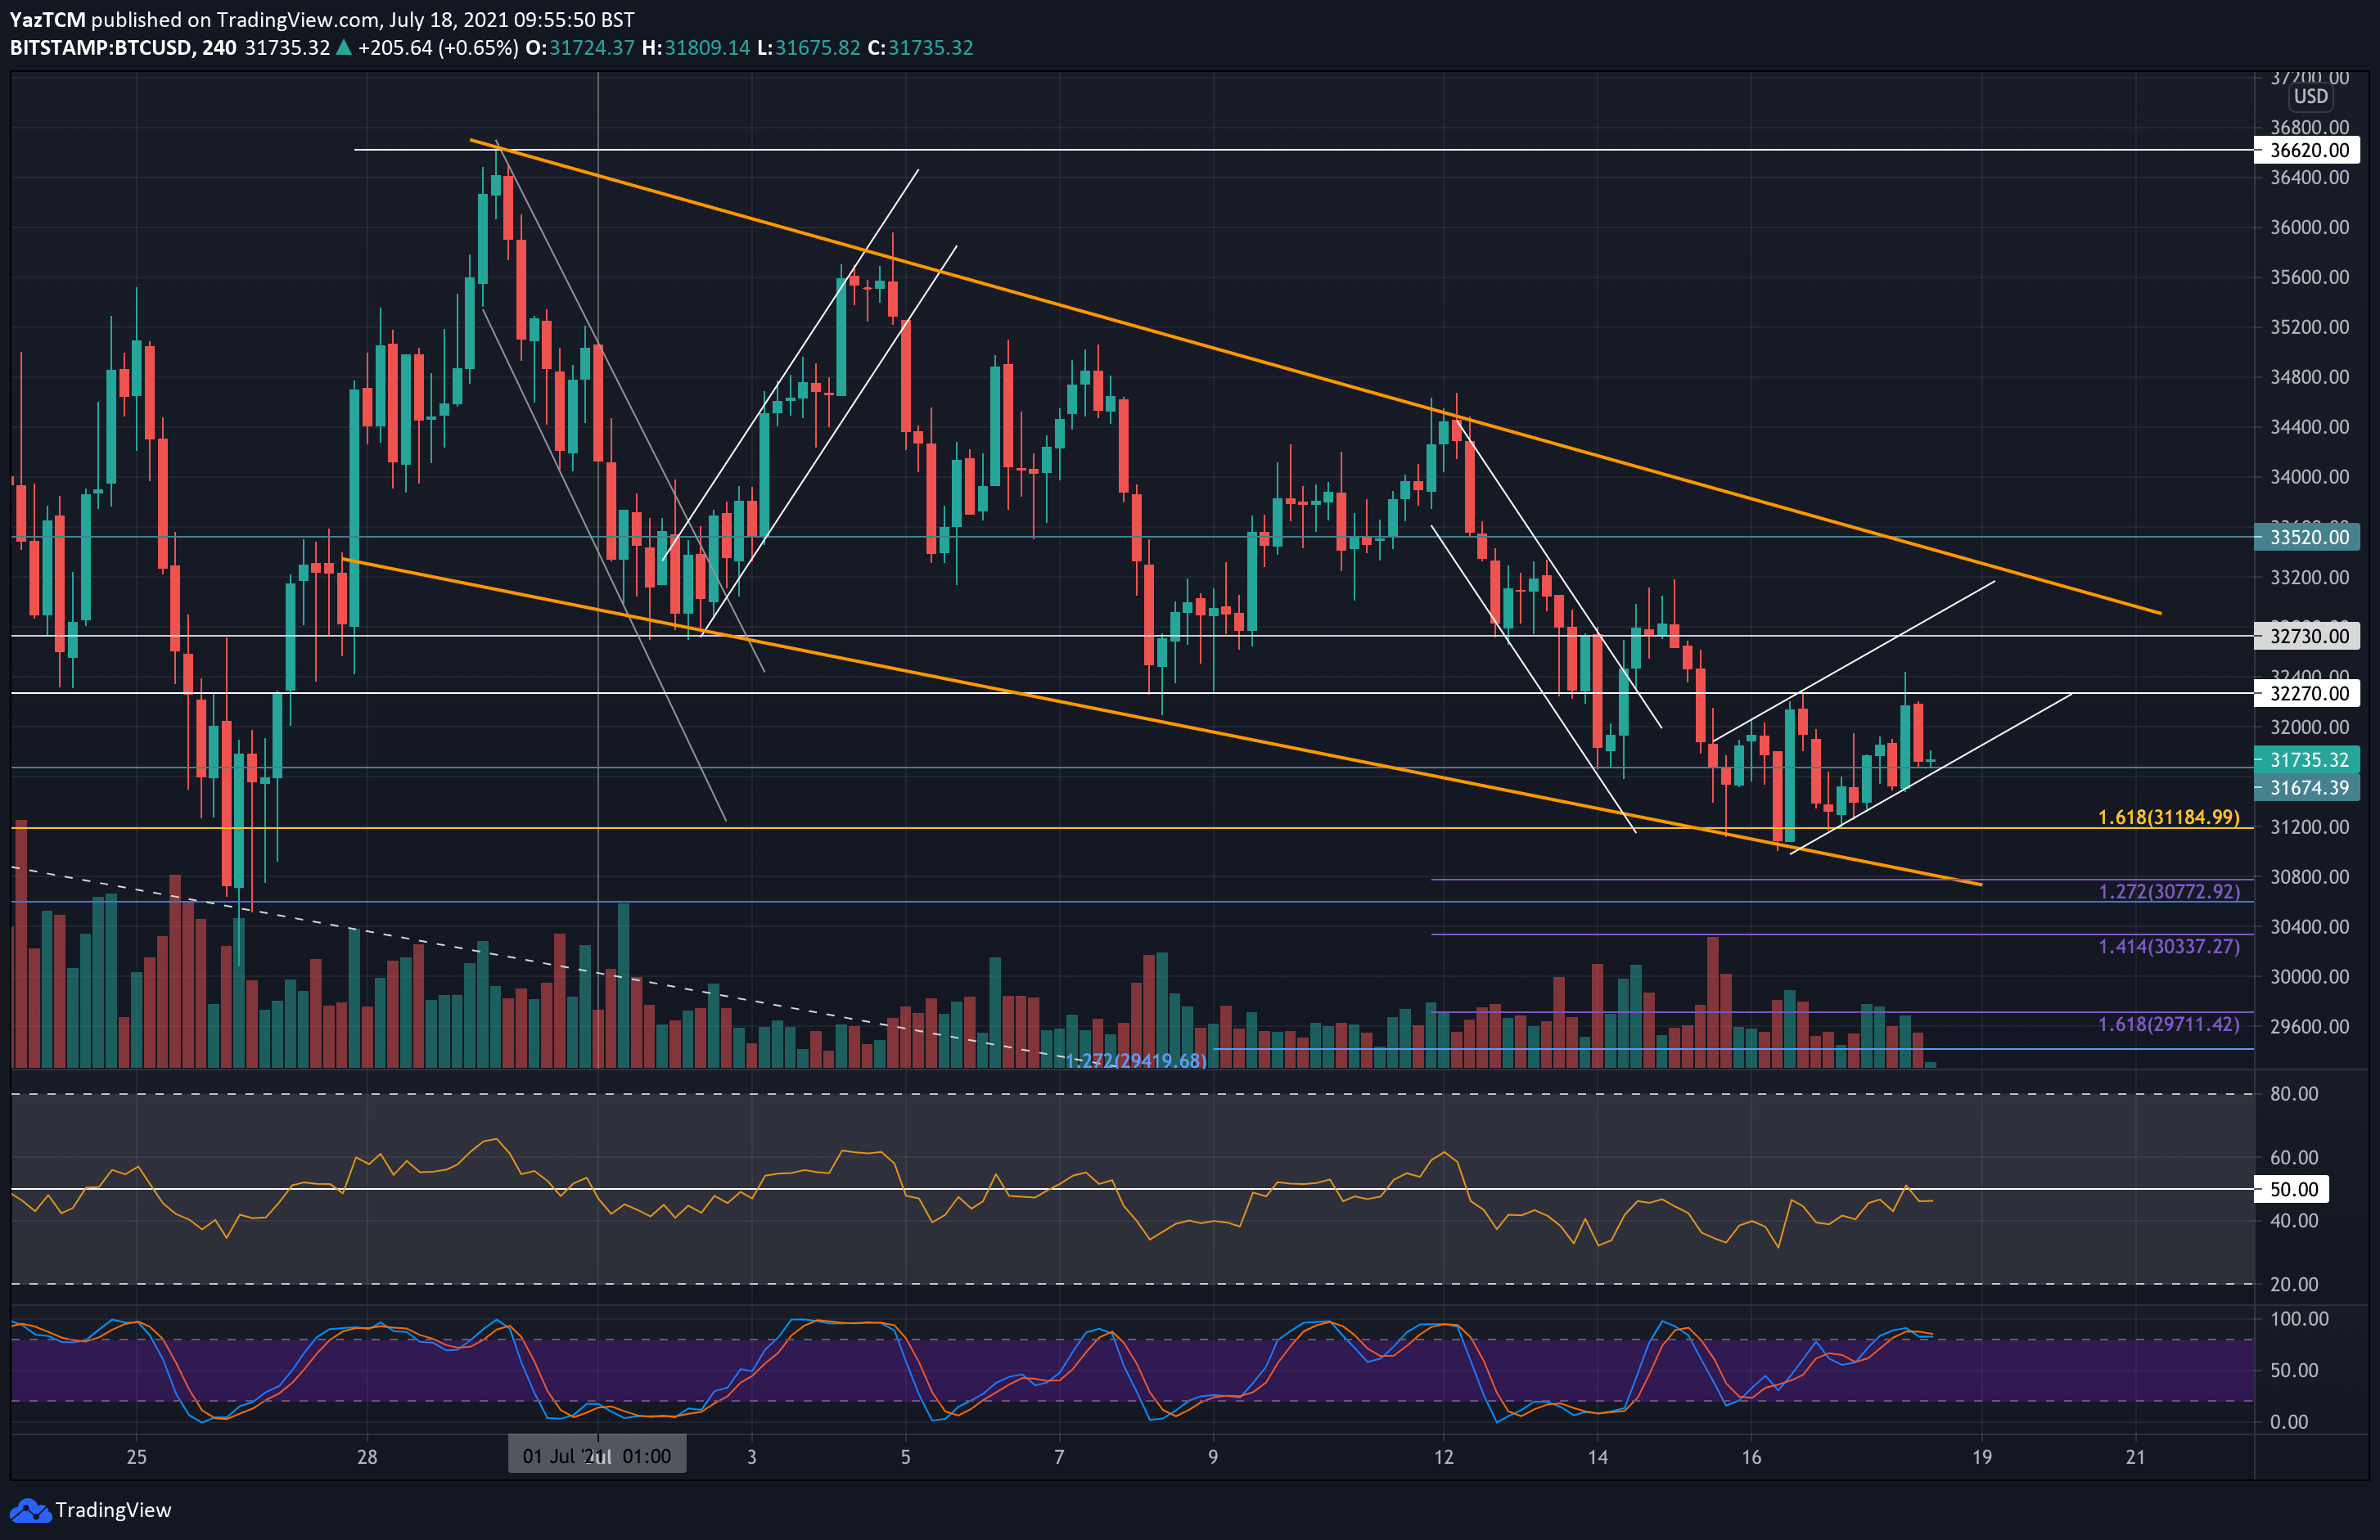
Looking at the 4-hour chart, BTC is trading inside a descending price channel since the start of June. It found support at the lower angle of this price channel on Friday and bounced from there to push into the resistance at $32,300. This has formed a short-term ascending price channel (white lines) that BTC is now trading inside.
So far over the past month, Bitcoin was able to “fix” the weekly candle by a decent price increase on Sundays, which left a long wick down. It remains to be seen if this ongoing Sunday will end up the same way.
BTC Price Support and Resistance Levels to Watch
Key Support Levels: $31,700, $30-31K, $29,400, $28.6K
Key Resistance Levels: $32,300 – $32,700, $33.5K, $35,000, $36,600.
Looking ahead, the first support lies at $31,700 – the lower angle of the short-term ascending price channel. This is closely followed by a critical support area amid the $30-31K range, which is the lower boundary of the triangle.
If $30K breakdown, the next support lies at $29,400 (downside 1.272 Fib Extension – blue), followed by $28.6K which is June’s low.
On the other side, the first resistance lies between $32,300 (short-term resistance) and $32,700 (upper angle of the triangle). This is followed by $33.5K (upper angle of the descending price channel and 20-day MA), $35,000 (50-day MA), and $36,600 (late-June highs).
The daily RSI remains beneath the midline and below the long-term descending trend line (blue line), preventing momentum from creating a higher high since February. A breakout of this blue line would indicate that the momentum is finally ready to increase on a longer-term basis.
Bitstamp BTC/USD Daily Chart

Bitstamp BTC/USD 4-Hour Chart


