Bitcoin Price Analysis: Bitcoin Holds The Crucial Support Line, Preparing For a Huge Move This Week
After touching the significant 200-days moving average line at $9,060, Bitcoin quickly got rejected down to $8400. From there, the cryptocurrency had a three-day consolidation around $8600; however, after breaking it down, the bearish momentum had recorded $8200 as the weekly low.
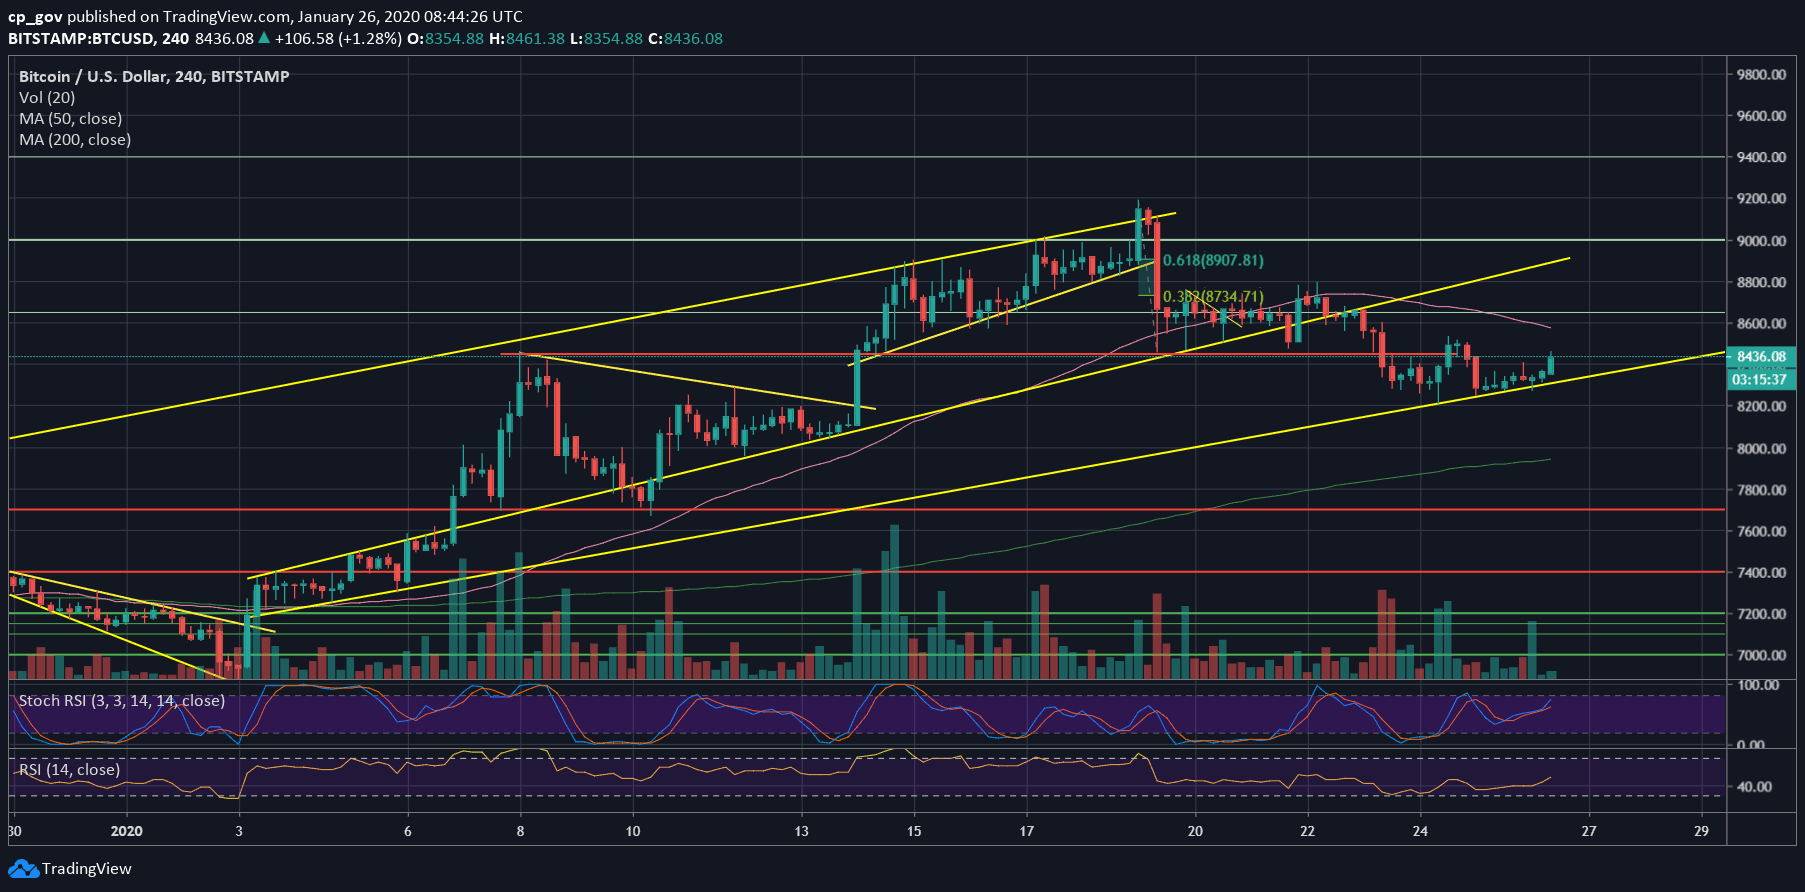
Coincidence? When looking at the following 4-hour chart, we can see that the past month’s price move is reflected on the marked ascending channel accurately, whereas the $8200 is the lower boundary of the channel.
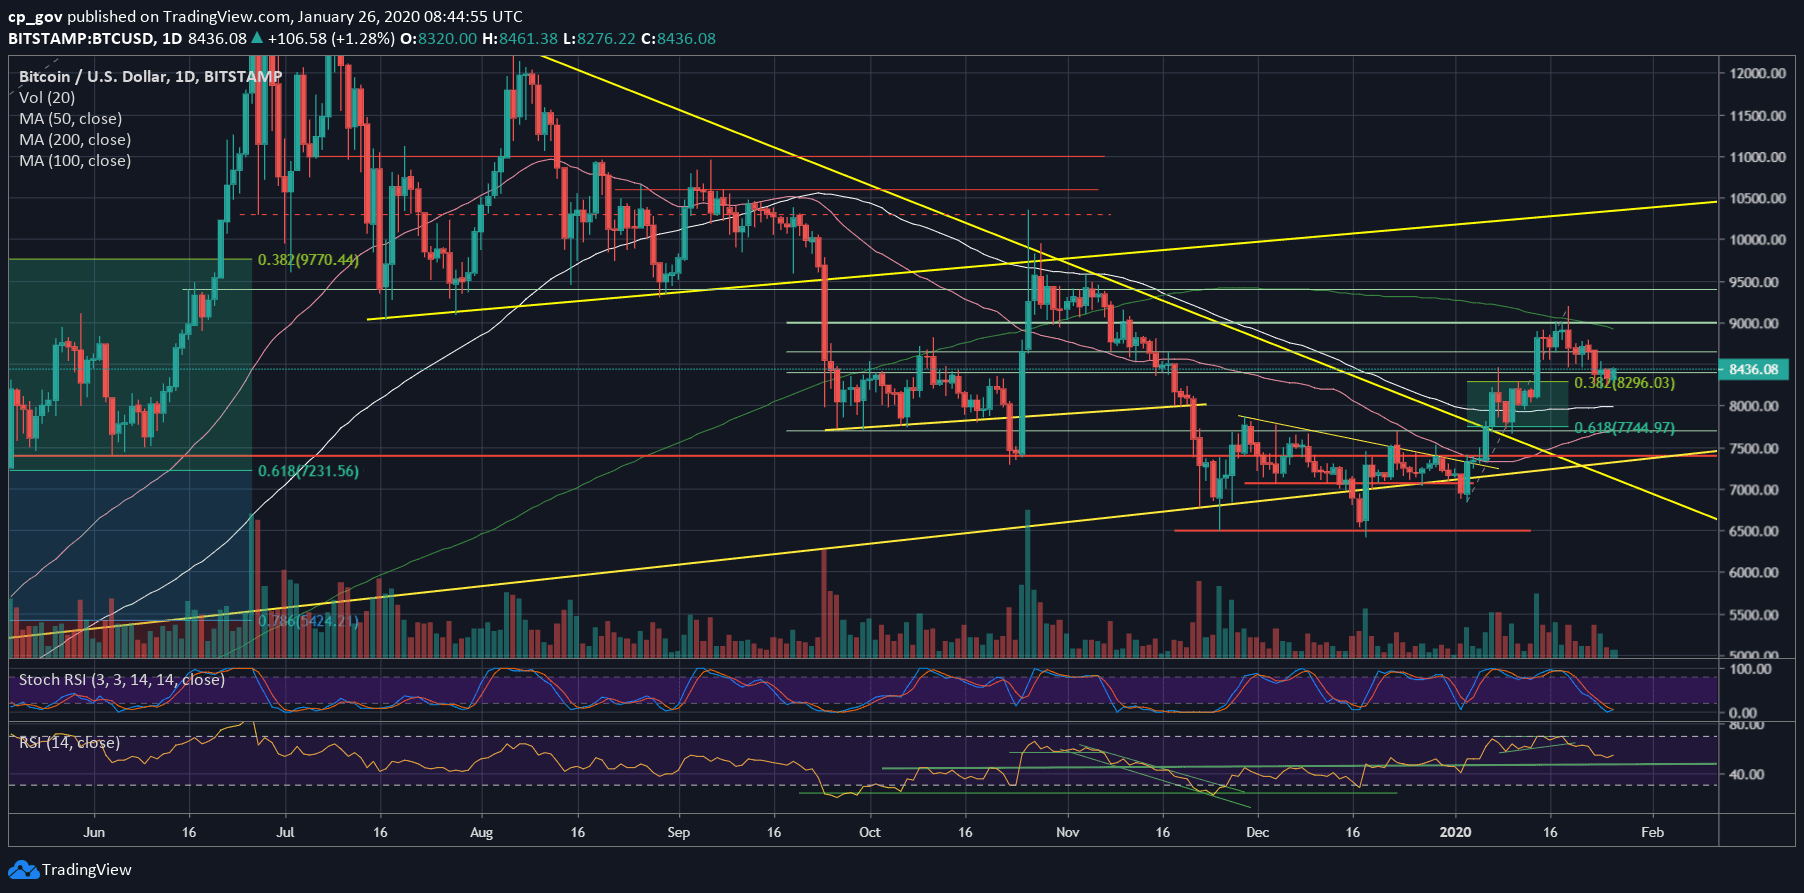
Bitcoin found support there, along with the 38.2% Fibonacci retracement level from the daily chart (~$8300). As of writing these lines, Bitcoin is slightly making its pace above, currently dealing with the support turned resistance level of $8400 – $8460 (as a reminder the last was the low of the past week, which was tested four times before got broken down).
Keep in mind that it’s still the weekend, and it’s also the Chinese New Year. As we mentioned before, the holiday tends to be bearish for Bitcoin.
With some caution, as mentioned here in the latest price analysis, the correction is so far healthy, as long as Bitcoin respects the marked ascending channel.
Total Market Cap: $231.7 billion
Bitcoin Market Cap: $153.2 billion
BTC Dominance Index: 66.0%
*Data by CoinGecko
Key Levels To Watch & Next Targets
– Support/Resistance levels: As mentioned above, Bitcoin is retesting the $8400 – $8450, but now as resistance.
In case of a break-up, then the next target for Bitcoin is likely to be the $8600 price area, which also contains the 4-hour MA-50 (the pink white line). Further above lies $8800 and $8900, which includes the significant 200-days moving average line (marked by the light green line on the following daily chart).
From below, the first level of support is the Fib level of $8300, along with the lower descending trend-line, which builds-up the ascending channel. Further down lies the weekly low at $8200, before reaching to the $8000 area, which contains the 100-days moving average line (white line).
– The RSI Indicator: As mentioned here in our previous analysis, the momentum indicator found support above the 54-55 RSI level.
A bullish sign might be coming on behalf of the Stochastic RSI oscillator. The last is about to go through a cross-over at the oversold territory.
– Trading volume: The volume is relatively low over the past days, this can be explained by the Chinese Holidays.
BTC/USD BitStamp 4-Hour Chart

BTC/USD BitStamp 1-Day Chart

The post Bitcoin Price Analysis: Bitcoin Holds The Crucial Support Line, Preparing For a Huge Move This Week appeared first on CryptoPotato.


