Bitcoin Price Analysis: Back In Action, Facing Huge Resistance – $8000 Or $6800 Next?
Over the past days, the first ones of 2020, we received a reminder of the typical behavior of the Bitcoin price.
As we pointed out about the trading volume, which was declining through the past week, we did get a considerable price action day (yesterday), recording the highest amount of volume of the past ten days.
After breaking down the $7070 support mark, we saw a rapid drop to $6850. As stated before, the area of the next support level. This was maybe enough for Bitcoin, and together with some fundamental help from Donald Trump, Bitcoin surged $500 daily.
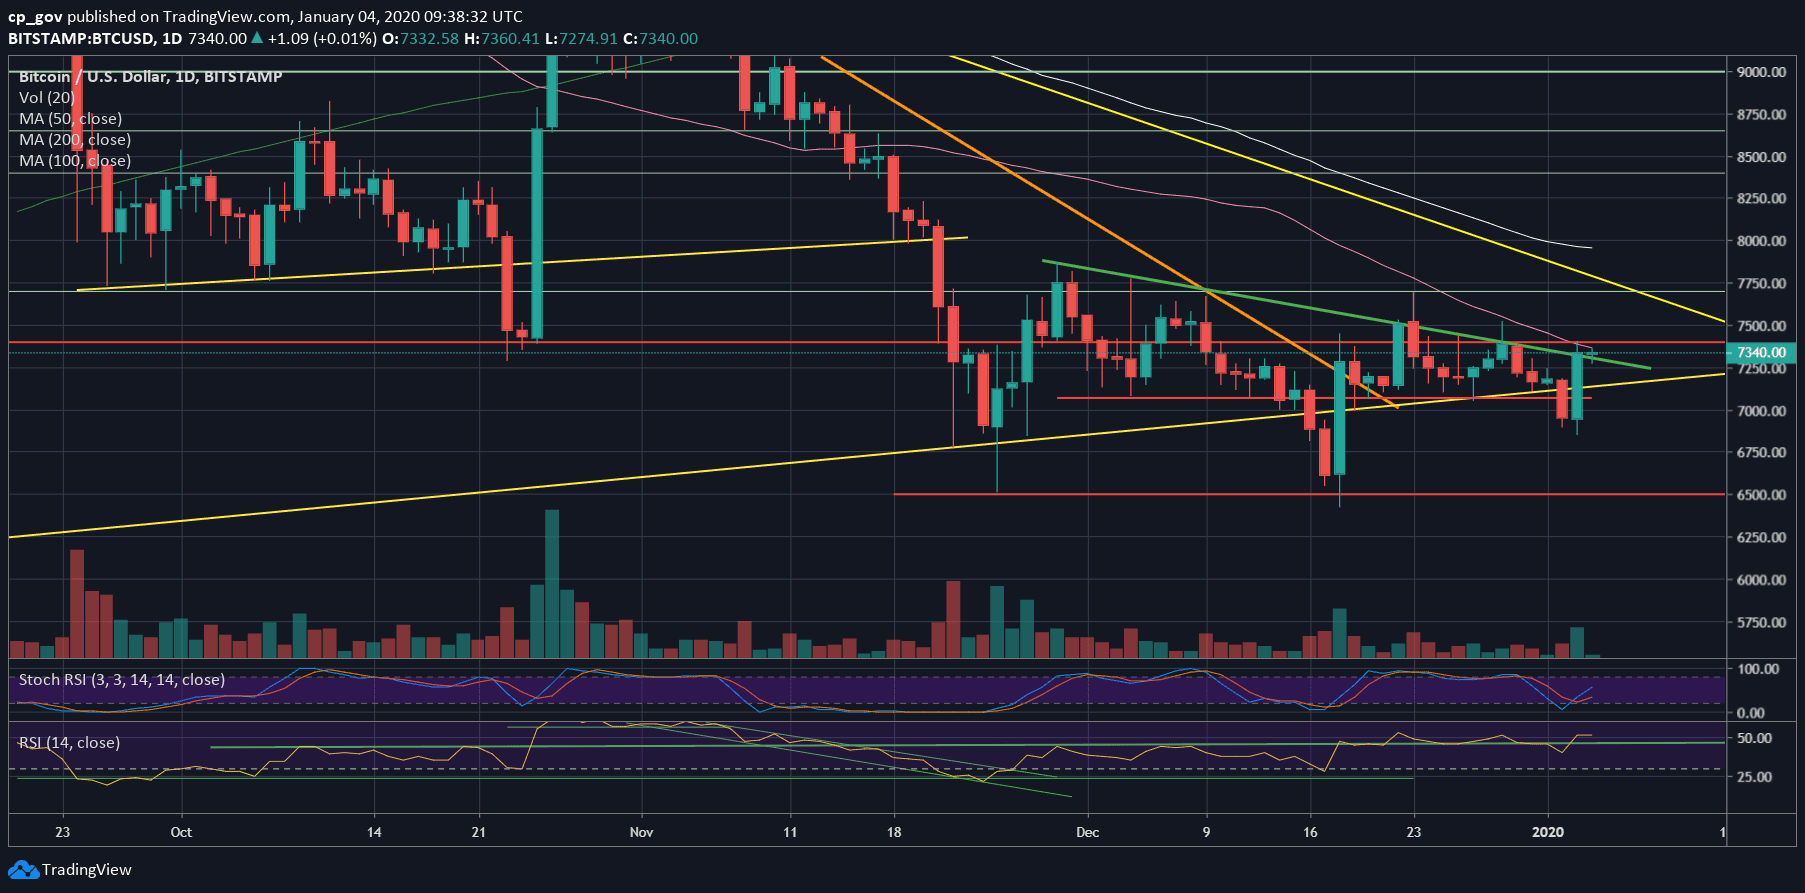
The price increase ended accurately at the confluence resistance zone which includes the green-marked descending trend-line on the daily (that line is ‘blocking’ Bitcoin for six weeks already). The resistance area also consists of the 50-days moving average line (the pink line) and resistance of $7400.
This won’t be so easy, but a bullish continuation is possible from here, but the condition will be to overcome the above resistance (daily candle above $7400, in my opinion).
Total Market Cap: $195.8 billion
Bitcoin Market Cap: $133.7 billion
BTC Dominance Index: 68.2%
*Data by CoinGecko
Key Levels to Watch
– Support/Resistance: As mentioned above, Bitcoin is one more time facing the confluence zone of $7300 – $7400.
The next resistance lies at $7700, which contains the significant mid-term descending trend-line. Further above is $7800 and $8000.
From below, the first level of support is $7200, together with the mid-term ascending trend-line. The next support is the $7000 – $7070 price zone, before yesterday’s low at $6850.
– The RSI Indicator: Despite a small glitch, the 45 RSI support line had been kept firm. The RSI is now supporting the continuation of the current bullish move; however, anything can be changed at any given moment.
– Trading volume: discussed above.
BTC/USD BitStamp 1-Day Chart
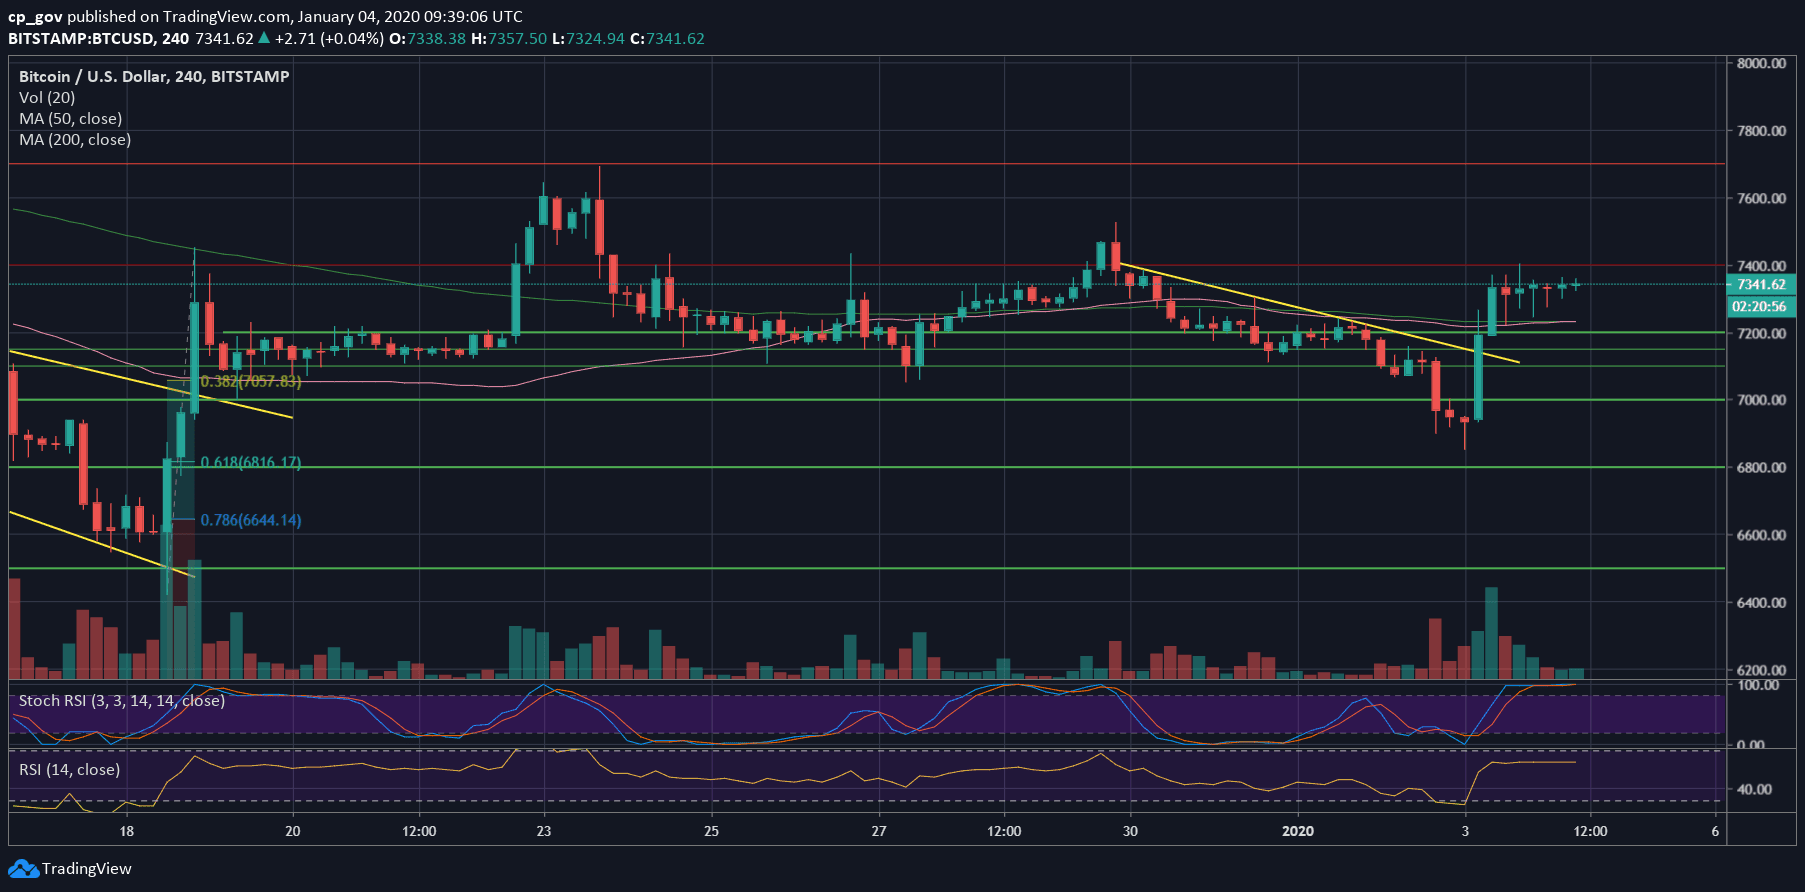
BTC/USD BitStamp 4-Hour Chart
The post Bitcoin Price Analysis: Back In Action, Facing Huge Resistance – $8000 Or $6800 Next? appeared first on CryptoPotato.