Bitcoin Price Analysis August 19
Not much have changed from our previous analysis just two days ago: “For the past 10 days Bitcoin’s range is between $6000 – $6600 (except little glitches below).”
During the past 48 hours the $6600 tough resistance level had been tested one more time, and a quick regression down to $6300.
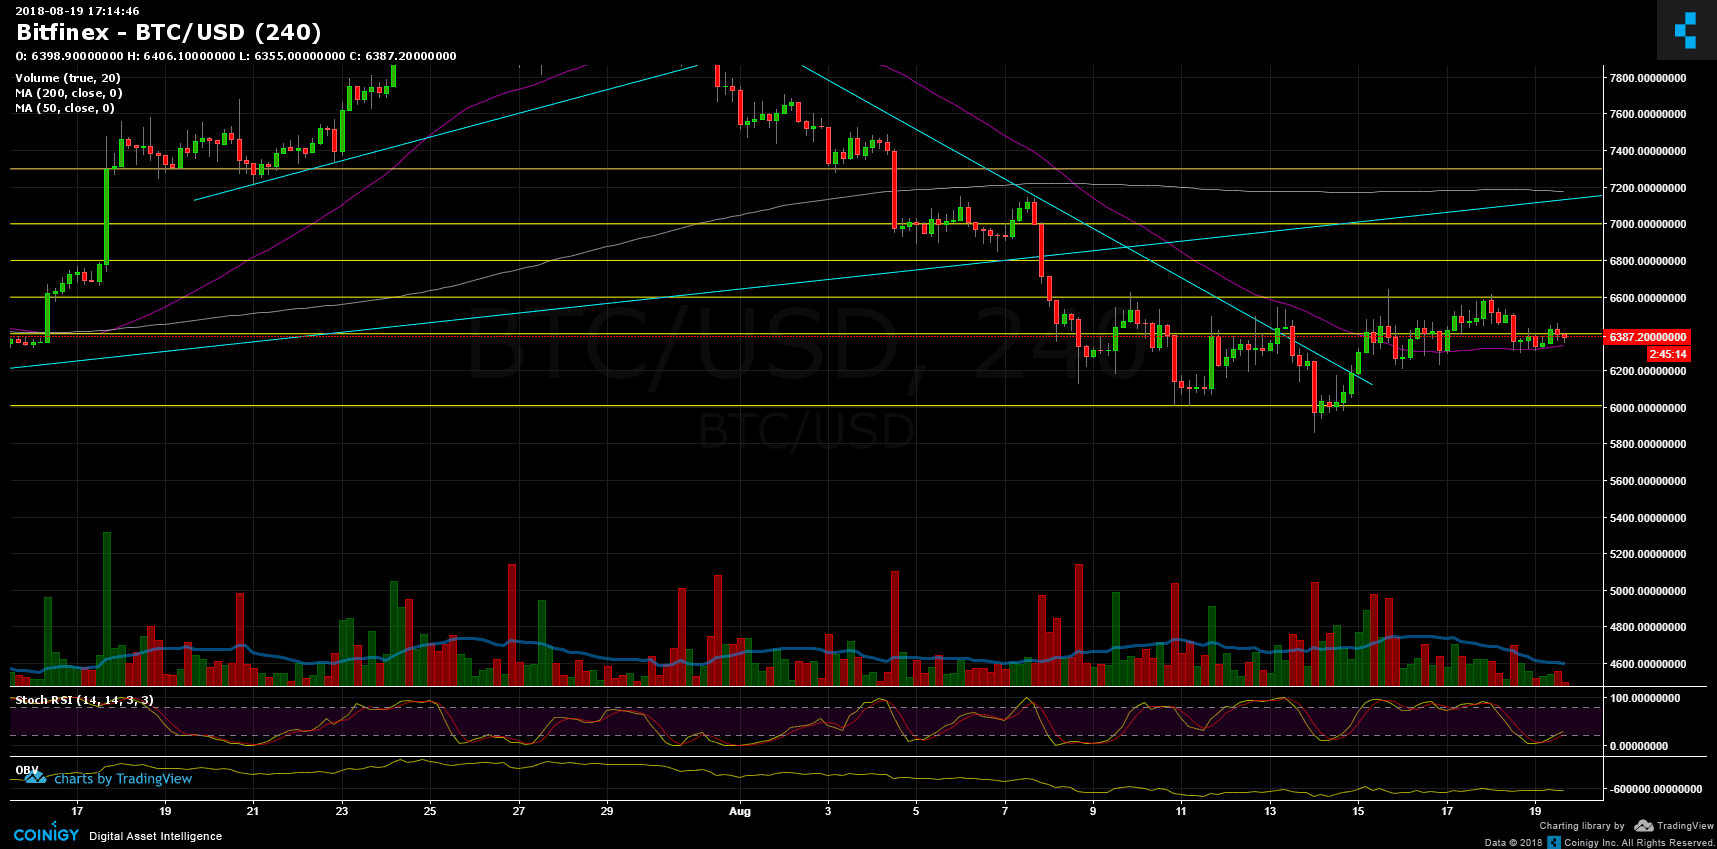
Over the past 4 days the range has become tighter – $6300 – $6600. Strong support around $6300 area (along with Moving Average 50 days – purple line), strong resistance around $6600. A break will likely lead to re-test $6800 and $7200 (Moving Average 200 days) Bitcoin levels.
Typically to weekends, the trading volume is relatively low – not much happening. It will be interesting to see what the heavy whales are preparing us for the new upcoming week.
Bitcoin Prices: BTC/USD BitFinex 4 Hours chart
The post Bitcoin Price Analysis August 19 appeared first on CryptoPotato.