Bitcoin Price Analysis August 17
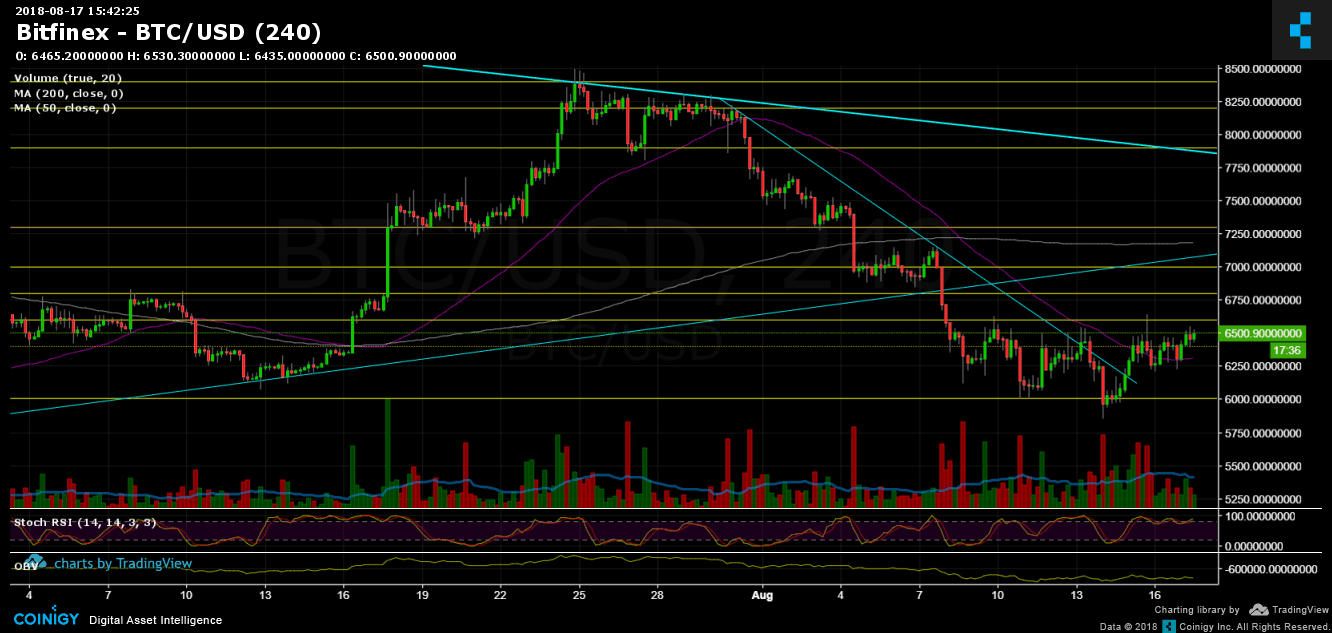
For the past 10 days Bitcoin’s range is between $6000 – $6600 (except little glitches below). The last day there is a relief in the whole crypto market and the market cap had gained around $20 B.
In market cycles, the last part of the bear market is called “capitulation” and it really reminds the heavy sell-off we’ve seen 3-4 days ago. However, Bitcoin found its support by the important Moving Average 50 days level (the purple line) and did not create a new year low by staying above the $6K mark.
Is this the end of the bearish period (we can definitely say that 2018 was terrible so far) – only time will tell. Bitcoin will need to break the tough $6600 resistance area in order for this to happen and to give it a chance and finally create a higher low. Above $6600 there are the $6800 (weak) and $7200 (Moving average 200 days) strong resistance levels.
From the bear side – support at $6400, $6000 and support (yearly low) around $5800 mark.
Bitcoin Prices: BTC/USD BitFinex 4 Hours chart
The post Bitcoin Price Analysis August 17 appeared first on CryptoPotato.