Bitcoin Price Analysis August 14
Bear market definition is when the chart is creating lower highs. Since our previous BTC price analysis, Bitcoin had created one more lower high, around $6550.
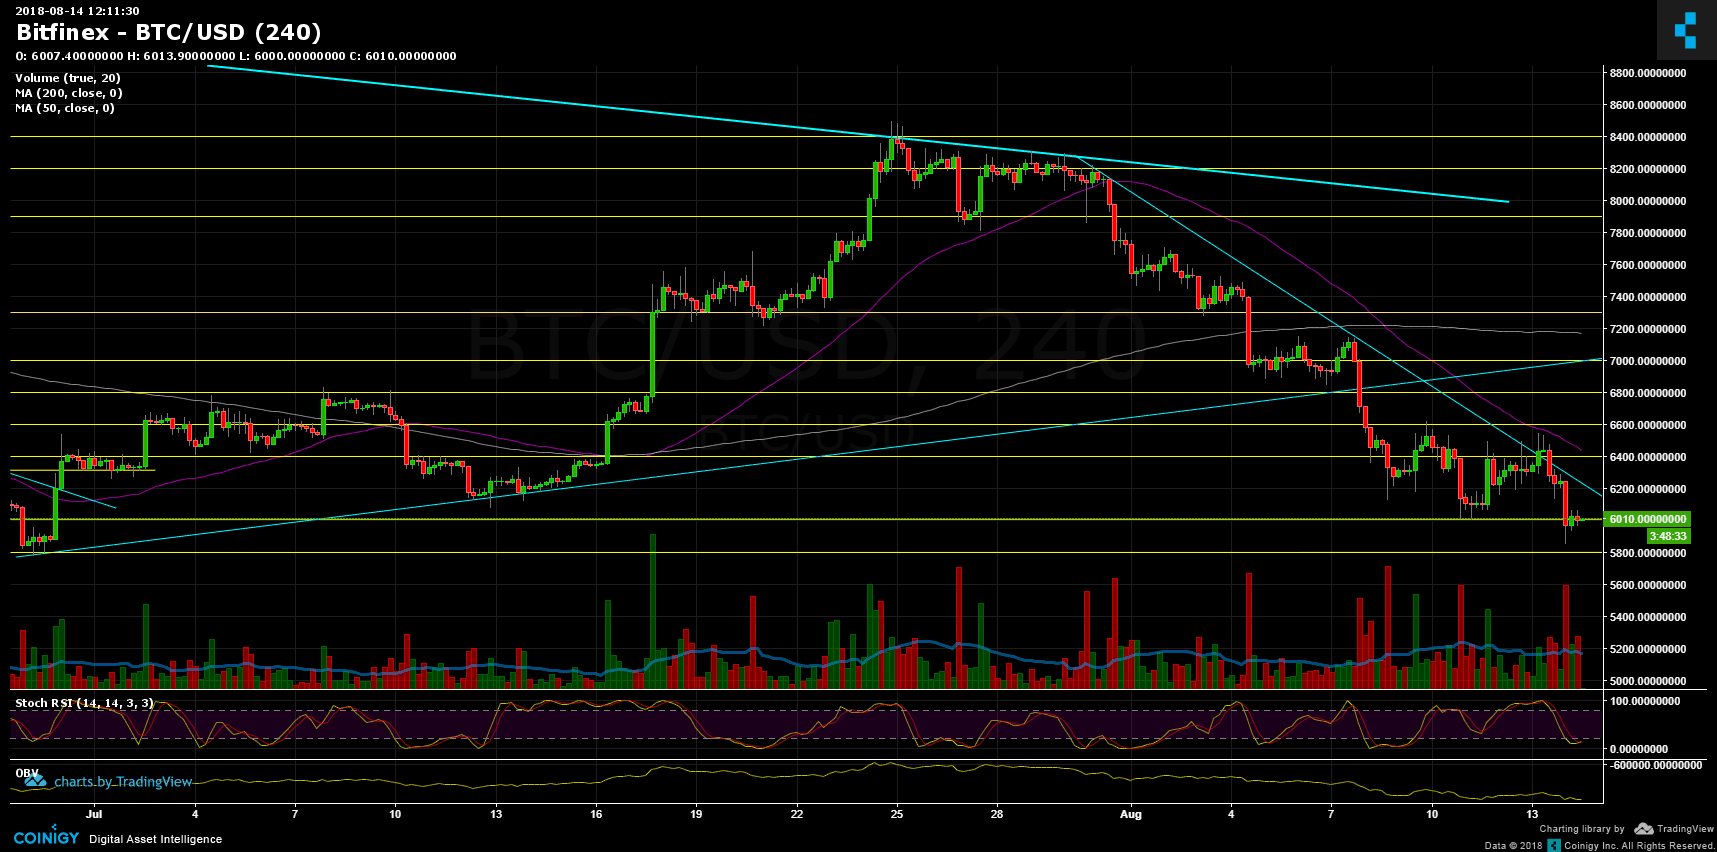
Over the last hours, Bitcoin is struggling to keep its head above the important $6000 support level, while checking the $5800 area. Breaking down the $5700 – $5800 zone, will likely to create a massive washout to the $5000 – $5300 support area.
Trading volume of the sellers is huge comparing to the buyers. As long as it will stay this way, we can expect the market to stay bearish.
From the bull side – the important resistance level is $6400 – Moving average 50 days, and $6600. Also, breaking up the $6600 will be a very positive sign for the market (might end up the lower highs).
Bitcoin Prices: BTC/USD BitFinex 4 Hours chart
The post Bitcoin Price Analysis August 14 appeared first on CryptoPotato.