Bitcoin Price Analysis: As the Market Calms Down, Does the Weekend Portend Another Volatile Move?
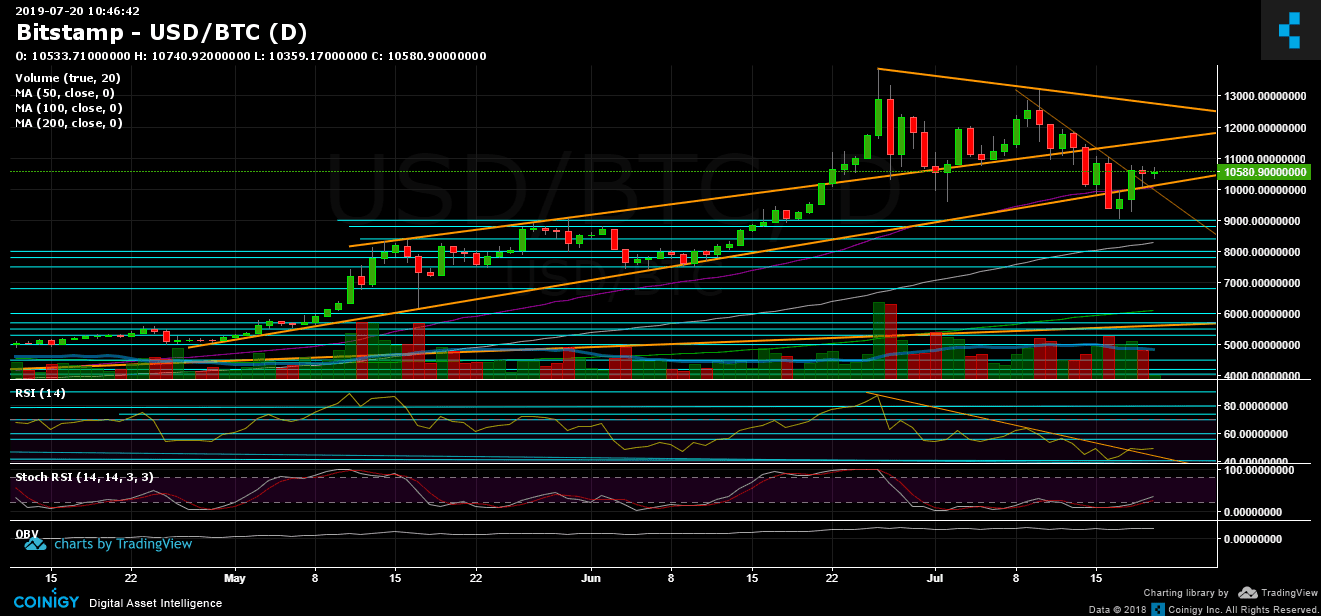
Bitcoin’s volatility continues. Ever since breaking below the significant $11,200 support level along with the upper ascending trend line (shown on the daily chart), Bitcoin has been a volatility machine.
The coin’s price fell to $9,800 (the 50-day moving average), moved back up to $11,000, then fell back down to $9,000 (the low since the current bull run began, and a lower low compared to $9,600), just to touch $10,000 a few hours afterward. From there, a stunning 1-day move down to $9,200, then the unbelievable 30-minute green candle that flirted with the $10,800 resistance level.
Following that, Bitcoin re-tested the $10,000 area, but as of writing this, the coin is trading around the resistance at $10,600.
What’s going on Here? Is Bitcoin Bearish or Bullish?
This is a tough question to answer. By looking at the longer-term trend line, we can see that Bitcoin has indeed been very bullish since 2019 began.
Mid-term: It’s clear from looking at the daily chart that Bitcoin couldn’t overcome the $11,000 – $11,200 supply zone, and until it does it will be hard to say that the bulls are in control. Also consider the RSI, which is hovering around 50 and displaying a lower low pattern.
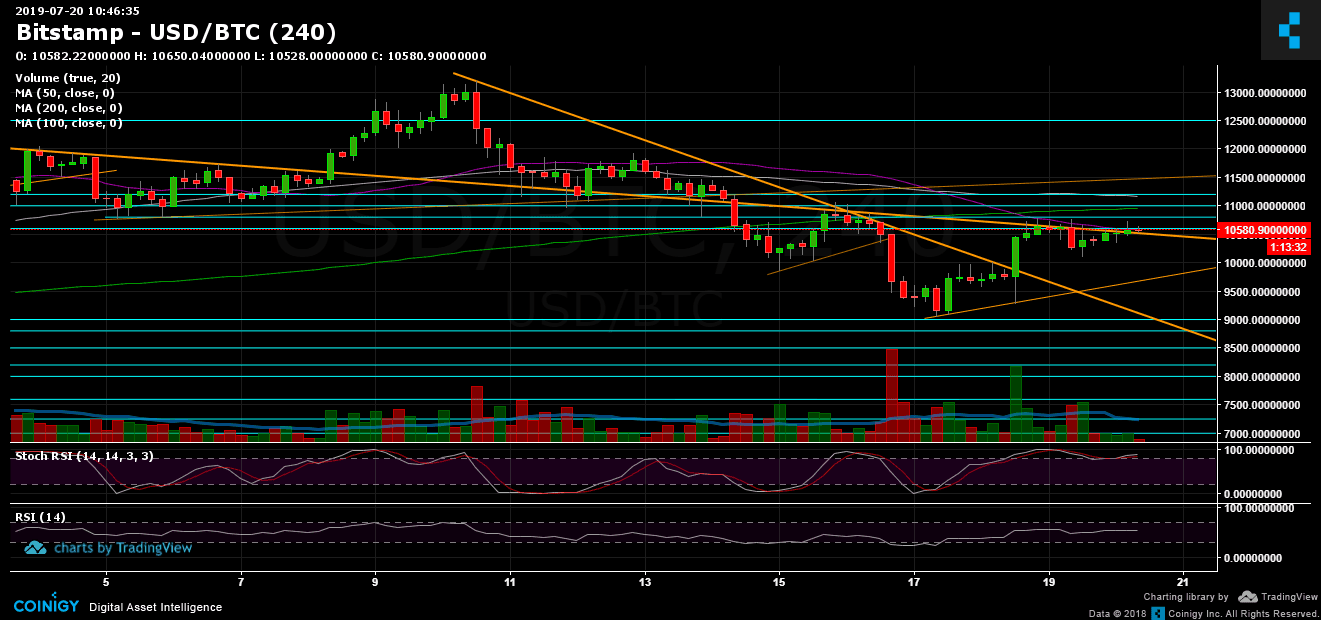
Looking at the 4-hour chart for a short-term view, we can see Bitcoin producing higher lows, and forming a bullish triangle pattern with a breakout possible above $10,800 and a possible target of $12,500.
Such market conditions are tough to trade. The direction could change at any moment, with extreme volatility.
Total Market Cap: $288 billion
Bitcoin Market Cap: $188 billion
BTC Dominance Index: 65.4%
*Data from CoinGecko
Key Levels to Watch
Support/Resistance: As mentioned above, Bitcoin faces resistance at $10,600. Breaking up, and the next level lies at $10,800 before $11,000 and $11,200. Further above is the significant mid-term ascending trend line that started forming in May 2019, and the significant area of $11,500 – $11,600. Breaking the latter, and the next levels are $12,000, $12,200 and $12,500.
From below, the nearest level of support lies at $10,300. Below is the $10,000 region along with the 50-day moving average line (marked in purple). Further below are $9,800, $9,600 and $9,400. Following them are the past week’s lows of around $9,000 – $9,200.
Daily chart’s RSI: Discussed above. The Stochastic RSI oscillator recently produced the anticipated cross-over in the oversold area into bullish territory, which could be a game-changing bullish indicator for Bitcoin.
Trading Volume: The past week was characterized by huge volatility in both directions. At this moment it’s hard to say which volume candles are larger – the buyers’ or the sellers’.
BTC/USD Bitstamp 4-Hour Chart
BTC/USD Bitstamp 1-Day Chart
The post Bitcoin Price Analysis: As the Market Calms Down, Does the Weekend Portend Another Volatile Move? appeared first on CryptoPotato.